Lowe's 2012 Annual Report Download - page 64
Download and view the complete annual report
Please find page 64 of the 2012 Lowe's annual report below. You can navigate through the pages in the report by either clicking on the pages listed below, or by using the keyword search tool below to find specific information within the annual report.-
 1
1 -
2
-
3
-
4
-
5
-
6
-
7
-
8
-
9
-
10
-
11
-
12
-
13
-
14
-
15
-
16
-
17
-
18
-
19
-
20
-
21
-
22
-
23
-
24
-
25
-
26
-
27
-
28
-
29
-
30
-
31
-
32
-
33
-
34
-
35
-
36
-
37
-
38
-
39
-
40
-
41
-
42
-
43
-
44
-
45
-
46
-
47
-
48
-
49
-
50
-
51
-
52
-
53
-
 54
54 -
 55
55 -
 56
56 -
 57
57 -
 58
58 -
 59
59 -
 60
60 -
 61
61 -
 62
62 -
 63
63 -
 64
64 -
 65
65 -
 66
66 -
 67
67 -
 68
68 -
 69
69 -
 70
70 -
 71
71 -
 72
72 -
 73
73 -
 74
74 -
75
-
76
-
77
-
78
-
79
-
80
-
81
-
82
-
83
-
84
-
85
-
86
-
87
-
88
 |
 |

50
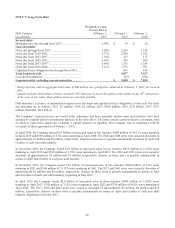
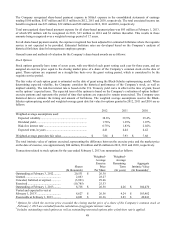
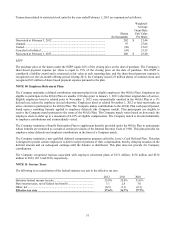
Transactions related to performance share units classified as equity awards for the year ended February 1, 2013 are
summarized as follows:
Units
(In thousands)1
Weighted-
Average
Grant-Date
Fair Value
Per Uni
t
N
onvested at February 3, 2012 .......................................................................... 424 $ 25.11
Granted .............................................................................................................. 418 26.60
Canceled or forfeited ......................................................................................... (112 ) 23.46
N
onvested at February 1, 2013 .......................................................................... 730 $ 25.42
Brand Differentiation Awards
Performance share units issued based on targeted Company improvement in brand differentiation, which is not considered
a market, performance, or service related condition, are classified as liability awards and are measured at fair value at each
reporting date. The awards are valued at the market price of a share of the Company’s common stock at the end of each
reporting period less the present value of dividends expected to be issued during the remaining requisite service period. The
weighted-average grant-date fair value per unit of performance share units classified as liability awards granted in 2012 and
2011 was $26.60 and $25.45, respectively. No performance share units were granted in 2010. No performance share units
vested in 2012, 2011, or 2010. The total liability for performance share units classified as liability awards at
February 1, 2013 was $5 million.
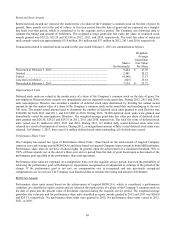
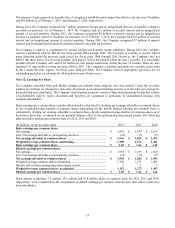
Transactions related to performance share units classified as liability awards for the year ended February 1, 2013 are
summarized as follows:
Units
(In thousands)1
Weighted-
Average
Grant-Date
Fair Value
Per Uni
t
N
onvested at February 3, 2012 ..........................................................................
.
194 $ 25.45
Granted ..............................................................................................................
.
206 26.60
Canceled or forfeited .........................................................................................
.
(41 ) 25.26
N
onvested at February 1, 2013 ..........................................................................
.
359 $ 25.42
¹ The number of units presented is based on achieving the targeted performance goals as defined in the performance share
unit agreements. As of February 1, 2013, the maximum number of units that could vest under the provisions of the
agreements were 1.1 million for the RONCAA awards and 0.5 million units for the brand differentiation awards.
Restricted Stock Units
Restricted stock units do not have dividend rights and are valued at the market price of a share of the Company’s common
stock on the date of grant less the present value of dividends expected during the requisite service period. In general, these
awards vest at the end of a three-year period from the date of grant and are expensed on a straight-line basis over that
period, which is considered to be the requisite service period. The Company uses historical data to estimate the timing and
amount of forfeitures. The weighted-average grant-date fair value per share of restricted stock units granted was $27.84,
$23.97 and $22.84 in 2012, 2011 and 2010, respectively. An insignificant amount of restricted stock units vested in 2012 ,
2011 and 2010.