Microsoft 2014 Annual Report Download - page 22
Download and view the complete annual report
Please find page 22 of the 2014 Microsoft annual report below. You can navigate through the pages in the report by either clicking on the pages listed below, or by using the keyword search tool below to find specific information within the annual report.-
 1
1 -
2
-
3
-
4
-
5
-
6
-
7
-
8
-
9
-
10
-
11
-
 12
12 -
 13
13 -
 14
14 -
 15
15 -
 16
16 -
 17
17 -
 18
18 -
 19
19 -
 20
20 -
 21
21 -
 22
22 -
 23
23 -
 24
24 -
 25
25 -
 26
26 -
 27
27 -
 28
28 -
 29
29 -
 30
30 -
 31
31 -
 32
32 -
33
-
34
-
35
-
36
-
37
-
38
-
39
-
40
-
41
-
42
-
43
-
44
-
45
-
46
-
47
-
48
-
49
-
50
-
51
-
52
-
53
-
54
-
55
-
56
-
57
-
58
-
59
-
60
-
61
-
62
-
63
-
64
-
65
-
66
-
67
-
68
-
69
-
70
-
71
-
72
-
73
-
74
-
75
-
76
-
77
-
78
-
79
-
80
-
81
-
82
-
83
-
84
-
85
-
86
-
87
-
88
 |
 |

21
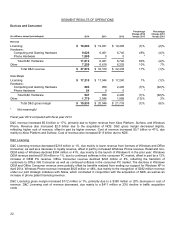
SUMMARY RESULTS OF OPERATIONS
(In millions, except percentages and per share amounts) 2014 2013 2012
Percentage
Change 2014
Versus 2013
Percentage
Change 2013
Versus 2012
Revenue $ 86,833 $ 77,849 $ 73,723 12% 6%
Gross margin $ 59,899 $ 57,600 $ 56,193 4% 3%
Operating income $ 27,759 $ 26,764 $ 21,763 4% 23%
Diluted earnings per share $ 2.63
$ 2.58 $ 2.00 2% 29%
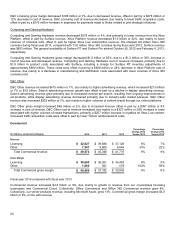
Fiscal year 2014 compared with fiscal year 2013
Revenue increased $9.0 billion or 12%, demonstrating growth across our consumer and commercial businesses, primarily
due to higher revenue from server products, Xbox Platform, Commercial Cloud, and Surface. Revenue also increased due
to the acquisition of NDS. Commercial Cloud revenue doubled, reflecting continued subscriber growth from our cloud-
based offerings.
Gross margin increased $2.3 billion or 4%, primarily due to higher revenue, offset in part by a $6.7 billion or 33% increase
in cost of revenue. Cost of revenue increased mainly due to higher volumes of Xbox consoles and Surface devices sold,
and $575 million higher datacenter expenses, primarily in support of Commercial Cloud revenue growth. Cost of revenue
also increased due to the acquisition of NDS.
Operating income increased $995 million or 4%, reflecting higher gross margin, offset in part by increased research and
development expenses and sales and marketing expenses. Key changes in operating expenses were:
• Research and development expenses increased $970 million or 9%, due mainly to increased investment in
new products and services in our Devices engineering group, including NDS expenses, and increased
investment in our Applications and Services engineering group.
• Sales and marketing expenses increased $535 million or 4%, primarily due to NDS expenses and increased
investment in sales resources, offset in part by lower advertising costs.
Fiscal year 2013 compared with fiscal year 2012
Revenue increased $4.1 billion or 6%, mainly due to growth in revenue from our Commercial segments. Revenue was
also impacted by the timing of revenue deferrals.
Operating income grew $5.0 billion or 23%, primarily due to the $6.2 billion goodwill impairment charge recorded during
the prior year. Other key changes in cost of revenue and operating expenses were:
• Cost of revenue increased $2.7 billion or 16%, reflecting increased product costs associated with Surface and
Windows 8, including an approximately $900 million charge for Surface RT inventory adjustments, higher
headcount-related expenses, payments made to Nokia related to joint strategic initiatives, royalties on Xbox
Live content, and retail stores expenses, offset in part by decreased costs associated with lower sales of Xbox
360 consoles and decreased traffic acquisition costs.
• Sales and marketing expenses increased $1.4 billion or 10%, reflecting advertising of Windows 8 and Surface.
• Research and development expenses increased $600 million or 6%, due mainly to higher headcount-related
expenses, largely related to the Xbox Platform.
• General and administrative expenses increased $580 million or 13%, due to higher legal charges, primarily due
to the European Commission fine of €561 million (approximately $733 million) for failure to comply with our
2009 agreement to display a “Browser Choice Screen” on Windows PCs where Internet Explorer is the default
browser (the “EU fine”).