Microsoft 2014 Annual Report Download - page 54
Download and view the complete annual report
Please find page 54 of the 2014 Microsoft annual report below. You can navigate through the pages in the report by either clicking on the pages listed below, or by using the keyword search tool below to find specific information within the annual report.-
 1
1 -
2
-
3
-
4
-
5
-
6
-
7
-
8
-
9
-
10
-
11
-
12
-
13
-
14
-
15
-
16
-
17
-
18
-
19
-
20
-
21
-
22
-
23
-
24
-
25
-
26
-
27
-
28
-
29
-
30
-
31
-
32
-
33
-
34
-
35
-
36
-
37
-
38
-
39
-
40
-
41
-
42
-
43
-
 44
44 -
 45
45 -
 46
46 -
 47
47 -
 48
48 -
 49
49 -
 50
50 -
 51
51 -
 52
52 -
 53
53 -
 54
54 -
 55
55 -
 56
56 -
 57
57 -
 58
58 -
 59
59 -
 60
60 -
 61
61 -
 62
62 -
 63
63 -
 64
64 -
65
-
66
-
67
-
68
-
69
-
70
-
71
-
72
-
73
-
74
-
75
-
76
-
77
-
78
-
79
-
80
-
81
-
82
-
83
-
84
-
85
-
86
-
87
-
88
 |
 |

53
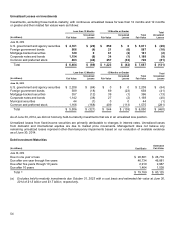
NOTE 4 — INVESTMENTS
Investment Components
The components of investments, including associated derivatives, but excluding held-to-maturity investments, were as
follows:
(In millions) Cost Basis
Unrealized
Gains
Unrealized
Losses
Recorded
Basis
Cash
and Cash
Equivalents Short-term
Investments
Equity
and Other
Investments
June 30, 2014
Cash $ 4,980 $ 0 $ 0 $ 4,980 $ 4,980 $ 0 $ 0
Mutual funds 590 0 0 590 590 0 0
Commercial paper 189 0 0 189 89 100 0
Certificates of deposit 1,197 0 0 1,197 865 332 0
U.S. government and agency
securities 66,952 103 (29) 67,026 109 66,917 0
Foreign government bonds 3,328 17 (10) 3,335 2,027 1,308 0
Mortgage-backed securities 991 30 (2) 1,019 0 1,019 0
Corporate notes and bonds 6,845 191 (9) 7,027 9 7,018 0
Municipal securities 287 45 0 332 0 332 0
Common and preferred stock 6,785 5,207 (81) 11,911 0 0 11,911
Other investments 1,164 0 0 1,164 0 14 1,150
Total $ 93,308 $ 5,593 $ (131) $ 98,770 $ 8,669 $ 77,040 $ 13,061
(In millions) Cost Basis
Unrealized
Gains
Unrealized
Losses
Recorded
Basis
Cash
and Cash
Equivalents
Short-term
Investments
Equity
and Othe
r
Investments
June 30, 2013
Cash $ 1,967 $ 0 $ 0 $ 1,967 $ 1,967 $ 0 $ 0
Mutual funds 868 0 0 868 868 0 0
Commercial paper 603 0 0 603 214 389 0
Certificates of deposit 994 0 0 994 609 385 0
U.S. government and agency
securities 64,934 47 (84) 64,897 146 64,751 0
Foreign government bonds 900 16 (41) 875 0 875 0
Mortgage-backed securities 1,258 43 (13) 1,288 0 1,288 0
Corporate notes and bonds 4,993 169 (40) 5,122 0 5,122 0
Municipal securities 350 36 (1) 385 0 385 0
Common and preferred stock 6,931 2,938 (281) 9,588 0 0 9,588
Other investments 1,279 0 0 1,279 0 23 1,256
Total $ 85,077 $ 3,249 $ (460) $ 87,866 $ 3,804 $ 73,218 $ 10,844
In addition to the investments in the table above, we also own corporate notes that were purchased in connection with our
agreement to lend $2.0 billion to the group that completed their acquisition of Dell on October 29, 2013. These corporate
notes are classified as held-to-maturity investments and are included in equity and other investments on the balance
sheet. As of June 30, 2014, the amortized cost, recorded basis, and estimated fair value of these corporate notes was
$1.5 billion, $1.5 billion, and $1.7 billion, respectively, while their associated gross unrecognized holding gains were
$164 million.
As of June 30, 2014 and 2013, the recorded bases of common and preferred stock that are restricted for more than one
year or are not publicly traded were $520 million and $395 million, respectively. These investments are carried at cost and
are reviewed quarterly for indicators of other-than-temporary impairment. It is not practicable for us to reliably estimate the
fair value of these investments.