Microsoft 2014 Annual Report Download - page 53
Download and view the complete annual report
Please find page 53 of the 2014 Microsoft annual report below. You can navigate through the pages in the report by either clicking on the pages listed below, or by using the keyword search tool below to find specific information within the annual report.-
 1
1 -
2
-
3
-
4
-
5
-
6
-
7
-
8
-
9
-
10
-
11
-
12
-
13
-
14
-
15
-
16
-
17
-
18
-
19
-
20
-
21
-
22
-
23
-
24
-
25
-
26
-
27
-
28
-
29
-
30
-
31
-
32
-
33
-
34
-
35
-
36
-
37
-
38
-
39
-
40
-
41
-
42
-
 43
43 -
 44
44 -
 45
45 -
 46
46 -
 47
47 -
 48
48 -
 49
49 -
 50
50 -
 51
51 -
 52
52 -
 53
53 -
 54
54 -
 55
55 -
 56
56 -
 57
57 -
 58
58 -
 59
59 -
 60
60 -
 61
61 -
 62
62 -
 63
63 -
64
-
65
-
66
-
67
-
68
-
69
-
70
-
71
-
72
-
73
-
74
-
75
-
76
-
77
-
78
-
79
-
80
-
81
-
82
-
83
-
84
-
85
-
86
-
87
-
88
 |
 |

52
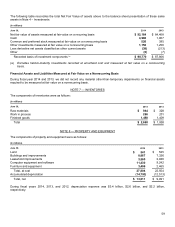
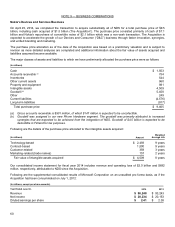
In May 2014, as part of its ongoing efforts to assist in the convergence of U.S. GAAP and International Financial
Reporting Standards, the FASB issued a new standard related to revenue recognition. Under the new standard,
recognition of revenue occurs when a customer obtains control of promised goods or services in an amount that reflects
the consideration to which the entity expects to receive in exchange for those goods or services. In addition, the standard
requires disclosure of the nature, amount, timing, and uncertainty of revenue and cash flows arising from contracts with
customers. The new standard will be effective for us beginning July 1, 2017 and early adoption is not permitted. We
anticipate this standard will have a material impact, and we are currently evaluating the impact this standard will have on
our consolidated financial statements.
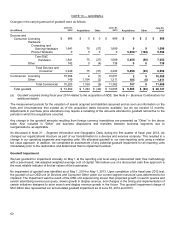
NOTE 2 — EARNINGS PER SHARE
Basic earnings per share (“EPS”) is computed based on the weighted average number of shares of common stock
outstanding during the period. Diluted EPS is computed based on the weighted average number of shares of common
stock plus the effect of dilutive potential common shares outstanding during the period using the treasury stock method.
Dilutive potential common shares include outstanding stock options and stock awards.
The components of basic and diluted EPS are as follows:
(In millions, except earnings per share)
Y
ear Ended June 30, 2014 2013 2012
Net income available for common shareholders (A) $ 22,074 $ 21,863 $ 16,978
Weighted average outstanding shares of common stock (B) 8,299 8,375 8,396
Dilutive effect of stock-based awards 100 95 110
Common stock and common stock equivalents (C) 8,399 8,470 8,506
Earnings Per Share
Basic (A/B) $ 2.66 $ 2.61 $ 2.02
Diluted (A/C) $ 2.63 $ 2.58 $ 2.00
Anti-dilutive stock-based awards excluded from the calculations of diluted EPS were immaterial during the periods
presented.
NOTE 3 — OTHER INCOME (EXPENSE)
The components of other income (expense) were as follows:
(In millions)
Y
ear Ended June 30, 2014 2013 2012
Dividends and interest income $ 883 $ 677 $ 800
Interest expense (597) (429) (380)
Net recognized gains on investments 437 116 564
Net losses on derivatives (328) (196) (364)
Net losses on foreign currency remeasurements (165) (74) (117)
Other (169) 194 1
Total $ 61 $ 288 $ 504
Following are details of net recognized gains (losses) on investments during the periods reported:
(In millions)
Y
ear Ended June 30, 2014 2013 2012
Other-than-temporary impairments of investments $ (106) $ (208) $ (298)
Realized gains from sales of available-for-sale securities 776 489 1,418
Realized losses from sales of available-for-sale securities (233) (165) (556)
Total $ 437 $ 116 $ 564