Microsoft 2014 Annual Report Download - page 26
Download and view the complete annual report
Please find page 26 of the 2014 Microsoft annual report below. You can navigate through the pages in the report by either clicking on the pages listed below, or by using the keyword search tool below to find specific information within the annual report.-
 1
1 -
2
-
3
-
4
-
5
-
6
-
7
-
8
-
9
-
10
-
11
-
12
-
13
-
14
-
15
-
 16
16 -
 17
17 -
 18
18 -
 19
19 -
 20
20 -
 21
21 -
 22
22 -
 23
23 -
 24
24 -
 25
25 -
 26
26 -
 27
27 -
 28
28 -
 29
29 -
 30
30 -
 31
31 -
 32
32 -
 33
33 -
 34
34 -
 35
35 -
 36
36 -
37
-
38
-
39
-
40
-
41
-
42
-
43
-
44
-
45
-
46
-
47
-
48
-
49
-
50
-
51
-
52
-
53
-
54
-
55
-
56
-
57
-
58
-
59
-
60
-
61
-
62
-
63
-
64
-
65
-
66
-
67
-
68
-
69
-
70
-
71
-
72
-
73
-
74
-
75
-
76
-
77
-
78
-
79
-
80
-
81
-
82
-
83
-
84
-
85
-
86
-
87
-
88
 |
 |

25
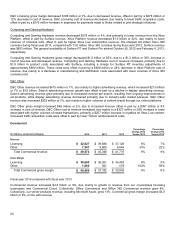
Commercial Licensing
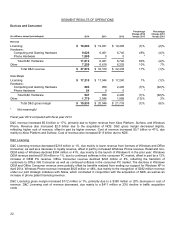
Commercial Licensing revenue increased $2.3 billion or 6%, due primarily to increased revenue from our server products,
as well as higher revenue from Windows Commercial and Office Commercial. Our server products revenue grew $1.7
billion or 11%, driven primarily by increased sales of Microsoft SQL Server. Windows Commercial revenue grew $334
million or 10%, due mainly to increased renewal rates and transactional purchases driven by Windows XP end of support.
Office Commercial revenue grew $253 million or 1%, and was impacted by customers transitioning to Office 365
Commercial.
Commercial Licensing gross margin increased $2.3 billion or 6%, in line with revenue growth.
Commercial Other
Commercial Other revenue increased $1.9 billion or 33%, due to higher Commercial Cloud revenue and Enterprise
Services revenue. Commercial Cloud revenue grew $1.5 billion or 116%, due mainly to higher revenue from Office 365
Commercial. Enterprise Services revenue grew $380 million or 9%, due mainly to growth in Premier Support Services.
Commercial Other gross margin increased $935 million or 102%, due to higher revenue, offset in part by a $952 million or
20% increase in cost of revenue. The increase in cost of revenue was due mainly to higher datacenter expenses,
reflecting support of our growing Commercial Cloud.
Fiscal year 2013 compared with fiscal year 2012
Commercial revenue increased $3.6 billion or 9%, due mainly to growth in revenue from our on-premises licensing
businesses and Commercial Cloud.
Commercial gross margin increased $2.1 billion or 6%.
Commercial Licensing
Commercial Licensing revenue increased $2.6 billion or 7%, due to increased revenue from all major commercial
offerings. Server products revenue increased $1.2 billion or 9%, driven primarily by growth in Microsoft SQL Server,
System Center, and Windows Server. Office Commercial revenue increased $622 million or 4%, reflecting growth in
Office revenue from volume licensing agreements with software assurance. Windows Commercial revenue increased
$379 million or 13%, reflecting continued support of our platform. Skype revenue increased, due primarily to including a
full year of results in fiscal year 2013.
Commercial Licensing gross margin increased $1.8 billion or 5%, due to higher revenue, offset in part by a $762 million or
29% increase in cost of revenue. Commercial Licensing cost of revenue increased, due to increased costs from all major
commercial offerings, including $287 million higher intellectual property licensing costs.
Commercial Other
Commercial Other revenue increased $1.0 billion or 22%, due to higher Commercial Cloud and Enterprise Services
revenue. Commercial Cloud revenue grew $582 million or 82%, due mainly to higher revenue from Office 365
Commercial. Enterprise Services revenue grew $434 million or 11%, due to growth in both Premier product support and
consulting services.