Microsoft 2014 Annual Report Download - page 24
Download and view the complete annual report
Please find page 24 of the 2014 Microsoft annual report below. You can navigate through the pages in the report by either clicking on the pages listed below, or by using the keyword search tool below to find specific information within the annual report.-
 1
1 -
2
-
3
-
4
-
5
-
6
-
7
-
8
-
9
-
10
-
11
-
12
-
13
-
 14
14 -
 15
15 -
 16
16 -
 17
17 -
 18
18 -
 19
19 -
 20
20 -
 21
21 -
 22
22 -
 23
23 -
 24
24 -
 25
25 -
 26
26 -
 27
27 -
 28
28 -
 29
29 -
 30
30 -
 31
31 -
 32
32 -
 33
33 -
 34
34 -
35
-
36
-
37
-
38
-
39
-
40
-
41
-
42
-
43
-
44
-
45
-
46
-
47
-
48
-
49
-
50
-
51
-
52
-
53
-
54
-
55
-
56
-
57
-
58
-
59
-
60
-
61
-
62
-
63
-
64
-
65
-
66
-
67
-
68
-
69
-
70
-
71
-
72
-
73
-
74
-
75
-
76
-
77
-
78
-
79
-
80
-
81
-
82
-
83
-
84
-
85
-
86
-
87
-
88
 |
 |

23
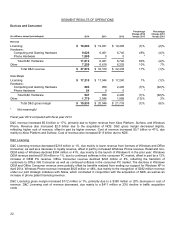
Computing and Gaming Hardware
Computing and Gaming Hardware revenue increased $3.2 billion or 49%, primarily due to higher revenue from the Xbox
Platform and Surface. Xbox Platform revenue increased $1.7 billion or 34%, due mainly to sales of Xbox One, which was
released in November 2013, offset in part by a decrease in sales of Xbox 360. We sold 11.7 million Xbox consoles during
fiscal year 2014 compared with 9.8 million Xbox consoles during fiscal year 2013. Surface revenue increased $1.3 billion
or 157%, due mainly to a higher number of devices and accessories sold.
Computing and Gaming Hardware gross margin decreased slightly, due to a $3.2 billion or 59% increase in cost of
revenue, offset in part by higher revenue. Xbox Platform cost of revenue increased $2.1 billion or 72%, due mainly to
higher volumes of consoles sold and higher costs associated with Xbox One. Surface cost of revenue increased $970
million or 51%, due mainly to a higher number of devices and accessories sold, offset in part by a charge for Surface RT
inventory adjustments of approximately $900 million in fiscal year 2013.
Phone Hardware
Phone Hardware revenue was $2.0 billion, reflecting sales of Lumia Smartphones and other non-Lumia phones following
the acquisition of NDS on April 25, 2014. Since the acquisition, we sold 5.8 million Lumia Smartphones and 30.3 million
non-Lumia phones.
Phone Hardware gross margin was $54 million, reflecting revenue of $2.0 billion, offset in part by $1.9 billion cost of
revenue, including amortization of acquired intangible assets and the impact of decisions to rationalize our device
portfolio.
D&C Other
D&C Other revenue increased $640 million or 10%, due mainly to higher online advertising revenue and Office 365
Consumer revenue, offset in part by a $213 million decrease in first-party video games revenue, primarily due to the
release of Halo 4 in the second quarter of fiscal year 2013. Online advertising revenue increased $497 million or
14%. Search advertising revenue increased 39%, due primarily to increased revenue per search resulting from ongoing
improvements in advertising products, higher search volume, and the expiration of North American revenue per search
guarantee payments to Yahoo! in the prior year, offset in part by a 25% reduction in display advertising revenue. Office
365 Consumer revenue grew $316 million, primarily reflecting subscriber growth. We ended fiscal year 2014 with over five
million subscribers.
D&C Other gross margin decreased $276 million or 13%, due to a $916 million or 20% increase in cost of revenue, offset
in part by higher revenue. D&C Other cost of revenue grew, due mainly to a $541 million or 24% increase in online
advertising cost of revenue, reflecting support of online infrastructure. Cost of revenue also increased $219 million or
15%, due to higher resale transactions costs.
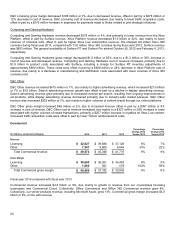
Fiscal year 2013 compared with fiscal year 2012
D&C revenue decreased $338 million or 1%, reflecting lower revenue from D&C Licensing and Computing and Gaming
Hardware, offset in part by increased revenue from D&C Other. D&C gross margin decreased $1.7 billion or 8%, primarily
due to higher cost of revenue and lower revenue. Cost of revenue increased $1.3 billion or 13%, primarily due to
Computing and Gaming Hardware.
D&C Licensing
D&C Licensing revenue decreased $474 million or 2%, due mainly to lower revenue from licenses of Consumer and
Windows OEM, offset in part by increased Windows Phone revenue. Office Consumer revenue declined $618 million or
15%, while Windows OEM revenue declined 10%. These decreases resulted primarily from the impact on revenue of a
decline in the x86 PC market, which we estimate declined approximately 9%. Windows Phone revenue increased $1.2
billion, including an increase in patent licensing revenue and sales of Windows Phone licenses.
In May 2013, we announced that we had surpassed 100 million licenses sold for Windows 8.