Microsoft 2014 Annual Report Download - page 25
Download and view the complete annual report
Please find page 25 of the 2014 Microsoft annual report below. You can navigate through the pages in the report by either clicking on the pages listed below, or by using the keyword search tool below to find specific information within the annual report.-
 1
1 -
2
-
3
-
4
-
5
-
6
-
7
-
8
-
9
-
10
-
11
-
12
-
13
-
14
-
 15
15 -
 16
16 -
 17
17 -
 18
18 -
 19
19 -
 20
20 -
 21
21 -
 22
22 -
 23
23 -
 24
24 -
 25
25 -
 26
26 -
 27
27 -
 28
28 -
 29
29 -
 30
30 -
 31
31 -
 32
32 -
 33
33 -
 34
34 -
 35
35 -
36
-
37
-
38
-
39
-
40
-
41
-
42
-
43
-
44
-
45
-
46
-
47
-
48
-
49
-
50
-
51
-
52
-
53
-
54
-
55
-
56
-
57
-
58
-
59
-
60
-
61
-
62
-
63
-
64
-
65
-
66
-
67
-
68
-
69
-
70
-
71
-
72
-
73
-
74
-
75
-
76
-
77
-
78
-
79
-
80
-
81
-
82
-
83
-
84
-
85
-
86
-
87
-
88
 |
 |

24
D&C Licensing gross margin decreased $196 million or 1%, due to decreased revenue, offset in part by a $278 million or
12% decrease in cost of revenue. D&C Licensing cost of revenue decreased, due mainly to lower traffic acquisition costs,
offset in part by a $375 million increase in expenses for payments made to Nokia related to joint strategic initiatives.
Computing and Gaming Hardware
Computing and Gaming Hardware revenue decreased $279 million or 4%, due primarily to lower revenue from the Xbox
Platform, offset in part by Surface revenue. Xbox Platform revenue decreased $1.3 billion or 22%, due mainly to lower
volumes of consoles sold, offset in part by higher Xbox Live subscription revenue. We shipped 9.8 million Xbox 360
consoles during fiscal year 2013, compared with 13.0 million Xbox 360 consoles during fiscal year 2012. Surface revenue
was $853 million. The general availability of Surface RT and Surface Pro started October 26, 2012 and February 9, 2013,
respectively.
Computing and Gaming Hardware gross margin decreased $1.5 billion or 62%, due to a $1.3 billion or 30% increase in
cost of revenue and decreased revenue. Computing and Gaming Hardware cost of revenue increased, primarily due to
$1.9 billion in product costs associated with Surface, including a charge for Surface RT inventory adjustments of
approximately $900 million. These costs were offset in part by a $920 million or 24% decrease in Xbox Platform cost of
revenue, due mainly to a decrease in manufacturing and distribution costs associated with lower volumes of Xbox 360
consoles sold.
D&C Other
D&C Other revenue increased $415 million or 7%, due mainly to higher advertising revenue, which increased $213 million
or 7% to $3.5 billion. Search advertising revenue growth was offset in part by a decline in display advertising revenue.
Search advertising revenue grew primarily due to increased revenue per search, resulting from ongoing improvements in
ad products, while display advertising revenue decreased primarily due to industry-wide market pressure. D&C Other
revenue also increased $202 million or 7%, due mainly to higher volumes of content resold through our online platforms.
D&C Other gross margin increased $48 million or 2%, due to increased revenue offset in part by a $367 million or 9%
increase in cost of revenue. D&C Other cost of revenue increased, due mainly to a $327 million or 28% increase in costs
associated with higher volumes of resale transactions, primarily a $257 million increase in royalties on Xbox Live content.
Increased traffic acquisition costs were offset in part by lower Yahoo! reimbursement costs.
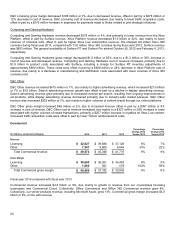
Commercial
(In millions, except percentages) 2014 2013 2012
Percentage
Change 2014
Versus 2013
Percentage
Change 2013
Versus 2012
Revenue
Licensing $ 42,027 $ 39,686 $ 37,126 6% 7%
Other 7,547
5,660 4,644 33% 22%
Total Commercial revenue $ 49,574 $ 45,346 $ 41,770 9% 9%
Gross Margin
Licensing $ 38,604 $ 36,261 $ 34,463 6% 5%
Other 1,856
921 579 102% 59%
Total Commercial gross margin $ 40,460 $ 37,182 $ 35,042 9% 6%
Fiscal year 2014 compared with fiscal year 2013
Commercial revenue increased $4.2 billion or 9%, due mainly to growth in revenue from our on-premises licensing
businesses and Commercial Cloud. Collectively, Office Commercial and Office 365 Commercial revenue grew 8%.
Collectively, our server products revenue, including Microsoft Azure, grew 13%. Commercial gross margin increased $3.3
billion or 9%, in line with revenue.