Microsoft 2014 Annual Report Download - page 32
Download and view the complete annual report
Please find page 32 of the 2014 Microsoft annual report below. You can navigate through the pages in the report by either clicking on the pages listed below, or by using the keyword search tool below to find specific information within the annual report.-
 1
1 -
2
-
3
-
4
-
5
-
6
-
7
-
8
-
9
-
10
-
11
-
12
-
13
-
14
-
15
-
16
-
17
-
18
-
19
-
20
-
21
-
 22
22 -
 23
23 -
 24
24 -
 25
25 -
 26
26 -
 27
27 -
 28
28 -
 29
29 -
 30
30 -
 31
31 -
 32
32 -
 33
33 -
 34
34 -
 35
35 -
 36
36 -
 37
37 -
 38
38 -
 39
39 -
 40
40 -
 41
41 -
 42
42 -
43
-
44
-
45
-
46
-
47
-
48
-
49
-
50
-
51
-
52
-
53
-
54
-
55
-
56
-
57
-
58
-
59
-
60
-
61
-
62
-
63
-
64
-
65
-
66
-
67
-
68
-
69
-
70
-
71
-
72
-
73
-
74
-
75
-
76
-
77
-
78
-
79
-
80
-
81
-
82
-
83
-
84
-
85
-
86
-
87
-
88
 |
 |
31
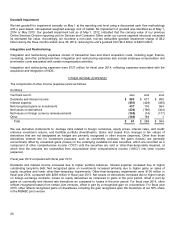
Securities lending
We lend certain fixed-income and equity securities to increase investment returns. The loaned securities continue to be
carried as investments on our balance sheet. Cash and/or security interests are received as collateral for the loaned
securities with the amount determined based upon the underlying security lent and the creditworthiness of the borrower.
Cash received is recorded as an asset with a corresponding liability. Our securities lending payable balance was $558
million as of June 30, 2014. Our average and maximum securities lending payable balances for the fiscal year were $619
million and $1.3 billion, respectively. Intra-year variances in the amount of securities loaned are mainly due to fluctuations
in the demand for the securities.
Valuation
In general, and where applicable, we use quoted prices in active markets for identical assets or liabilities to determine the
fair value of our financial instruments. This pricing methodology applies to our Level 1 investments, such as exchange-
traded mutual funds, domestic and international equities, and U.S. government securities. If quoted prices in active
markets for identical assets or liabilities are not available to determine fair value, then we use quoted prices for similar
assets and liabilities or inputs other than the quoted prices that are observable either directly or indirectly. This pricing
methodology applies to our Level 2 investments such as corporate notes and bonds, common and preferred stock, foreign
government bonds, mortgage-backed securities, and certificates of deposit. Level 3 investments are valued using
internally developed models with unobservable inputs. Assets and liabilities measured at fair value on a recurring basis
using unobservable inputs are an immaterial portion of our portfolio.
A majority of our investments are priced by pricing vendors and are generally Level 1 or Level 2 investments as these
vendors either provide a quoted market price in an active market or use observable inputs for their pricing without
applying significant adjustments. Broker pricing is used mainly when a quoted price is not available, the investment is not
priced by our pricing vendors, or when a broker price is more reflective of fair values in the market in which the investment
trades. Our broker-priced investments are generally classified as Level 2 investments because the broker prices these
investments based on similar assets without applying significant adjustments. In addition, all of our broker-priced
investments have a sufficient level of trading volume to demonstrate that the fair values used are appropriate for these
investments. Our fair value processes include controls that are designed to ensure appropriate fair values are recorded.
These controls include model validation, review of key model inputs, analysis of period-over-period fluctuations, and
independent recalculation of prices where appropriate.
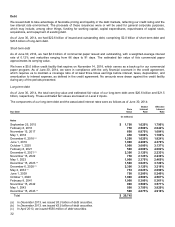
Cash Flows
Fiscal year 2014 compared with fiscal year 2013
Cash flows from operations increased $3.4 billion during the current fiscal year to $32.2 billion, due mainly to increases in
cash received from customers. Cash used in financing increased $246 million to $8.4 billion, due mainly to a $2.0 billion
increase in cash used for common stock repurchases, a $1.4 billion increase in dividends paid, and a $324 million
decrease in proceeds from the issuance of common stock, offset in part by a $3.4 billion increase in proceeds from
issuances of debt, net of repayments. Cash used in investing decreased $5.0 billion to $18.8 billion, due mainly to a $10.5
billion decrease in cash used for net investment purchases, sales, and maturities, offset in part by a $4.4 billion increase
in cash used for acquisition of companies and purchases of intangible and other assets, and a $1.2 billion increase in
capital expenditures for property and equipment.
Fiscal year 2013 compared with fiscal year 2012
Cash flows from operations decreased $2.8 billion during the current fiscal year to $28.8 billion, due mainly to changes in
working capital, including increases in inventory and other current assets. Cash used for financing decreased $1.3 billion
to $8.1 billion, due mainly to a $3.5 billion increase in proceeds from issuances of debt, net of repayments, offset in part
by a $1.1 billion increase in dividends paid and a $982 million decrease in proceeds from the issuance of common stock.
Cash used in investing decreased $975 million to $23.8 billion, due mainly to an $8.5 billion decrease in cash used for
acquisitions of companies and purchases of intangible and other assets, offset in part by a $5.8 billion increase in cash
used for net investment purchases, maturities, and sales, and a $2.0 billion increase in cash used for additions to property
and equipment.