Microsoft 2014 Annual Report Download - page 28
Download and view the complete annual report
Please find page 28 of the 2014 Microsoft annual report below. You can navigate through the pages in the report by either clicking on the pages listed below, or by using the keyword search tool below to find specific information within the annual report.-
 1
1 -
2
-
3
-
4
-
5
-
6
-
7
-
8
-
9
-
10
-
11
-
12
-
13
-
14
-
15
-
16
-
17
-
 18
18 -
 19
19 -
 20
20 -
 21
21 -
 22
22 -
 23
23 -
 24
24 -
 25
25 -
 26
26 -
 27
27 -
 28
28 -
 29
29 -
 30
30 -
 31
31 -
 32
32 -
 33
33 -
 34
34 -
 35
35 -
 36
36 -
 37
37 -
 38
38 -
39
-
40
-
41
-
42
-
43
-
44
-
45
-
46
-
47
-
48
-
49
-
50
-
51
-
52
-
53
-
54
-
55
-
56
-
57
-
58
-
59
-
60
-
61
-
62
-
63
-
64
-
65
-
66
-
67
-
68
-
69
-
70
-
71
-
72
-
73
-
74
-
75
-
76
-
77
-
78
-
79
-
80
-
81
-
82
-
83
-
84
-
85
-
86
-
87
-
88
 |
 |

27
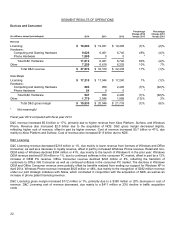
Fiscal year 2013 compared with fiscal year 2012
Research and development expenses increased, reflecting a $460 million or 6% increase in headcount-related expenses,
largely related to the Xbox Platform.
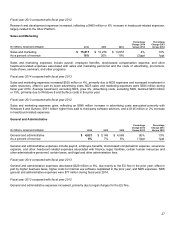
Sales and Marketing
(In millions, except percentages) 2014 2013 2012
Percentage
Change 2014
Versus 2013
Percentage
Change 2013
Versus 2012
Sales and marketing $ 15,811 $ 15,276 $ 13,857 4% 10%
As a percent of revenue 18%
20% 19% (2)ppt 1ppt
Sales and marketing expenses include payroll, employee benefits, stock-based compensation expense, and other
headcount-related expenses associated with sales and marketing personnel and the costs of advertising, promotions,
trade shows, seminars, and other programs.
Fiscal year 2014 compared with fiscal year 2013
Sales and marketing expenses increased $535 million or 4%, primarily due to NDS expenses and increased investment in
sales resources, offset in part by lower advertising costs. NDS sales and marketing expenses were $394 million during
fiscal year 2014. Average headcount, excluding NDS, grew 4%. Advertising costs, excluding NDS, declined $403 million
or 15%, primarily due to Windows 8 and Surface costs in the prior year.
Fiscal year 2013 compared with fiscal year 2012
Sales and marketing expenses grew, reflecting an $898 million increase in advertising costs associated primarily with
Windows 8 and Surface, $181 million higher fees paid to third-party software advisors, and a $145 million or 2% increase
in headcount-related expenses.
General and Administrative
(In millions, except percentages) 2014 2013 2012
Percentage
Change 2014
Versus 2013
Percentage
Change 2013
Versus 2012
General and administrative $ 4,821 $ 5,149 $ 4,569 (6)% 13%
As a percent of revenue 6%
7% 6% (1)ppt 1ppt
General and administrative expenses include payroll, employee benefits, stock-based compensation expense, severance
expense, and other headcount-related expenses associated with finance, legal, facilities, certain human resources and
other administrative personnel, certain taxes, and legal and other administrative fees.
Fiscal year 2014 compared with fiscal year 2013
General and administrative expenses decreased $328 million or 6%, due mainly to the EU fine in the prior year, offset in
part by higher business taxes, higher costs for internal use software capitalized in the prior year, and NDS expenses. NDS
general and administrative expenses were $77 million during fiscal year 2014.
Fiscal year 2013 compared with fiscal year 2012
General and administrative expenses increased, primarily due to legal charges for the EU fine.