Microsoft 2014 Annual Report Download - page 67
Download and view the complete annual report
Please find page 67 of the 2014 Microsoft annual report below. You can navigate through the pages in the report by either clicking on the pages listed below, or by using the keyword search tool below to find specific information within the annual report.-
 1
1 -
2
-
3
-
4
-
5
-
6
-
7
-
8
-
9
-
10
-
11
-
12
-
13
-
14
-
15
-
16
-
17
-
18
-
19
-
20
-
21
-
22
-
23
-
24
-
25
-
26
-
27
-
28
-
29
-
30
-
31
-
32
-
33
-
34
-
35
-
36
-
37
-
38
-
39
-
40
-
41
-
42
-
43
-
44
-
45
-
46
-
47
-
48
-
49
-
50
-
51
-
52
-
53
-
54
-
55
-
56
-
 57
57 -
 58
58 -
 59
59 -
 60
60 -
 61
61 -
 62
62 -
 63
63 -
 64
64 -
 65
65 -
 66
66 -
 67
67 -
 68
68 -
 69
69 -
 70
70 -
 71
71 -
 72
72 -
 73
73 -
 74
74 -
 75
75 -
 76
76 -
 77
77 -
78
-
79
-
80
-
81
-
82
-
83
-
84
-
85
-
86
-
87
-
88
 |
 |

66
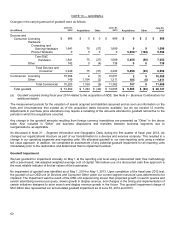
The items accounting for the difference between income taxes computed at the U.S. federal statutory rate and our
effective rate were as follows:
Y
ear Ended June 30, 2014 2013 2012
Federal statutory rate 35.0% 35.0% 35.0%
Effect of:
Foreign earnings taxed at lower rates (17.1)% (17.5)% (21.1)%
Goodwill impairment 0% 0% 9.7%
Other reconciling items, net 2.8% 1.7% 0.2%
Effective rate 20.7% 19.2% 23.8%
The reduction from the federal statutory rate from foreign earnings taxed at lower rates results from producing and
distributing our products and services through our foreign regional operations centers in Ireland, Singapore, and Puerto
Rico. Our foreign earnings, which are taxed at rates lower than the U.S. rate and are generated from our regional
operating centers, were 81%, 79%, and 79% of our foreign income before tax in fiscal years 2014, 2013, and 2012,
respectively. In general, other reconciling items consist of interest, adjustments for intercompany transfer pricing, U.S.
state income taxes, domestic production deductions, and credits. In fiscal years 2014, 2013, and 2012, there were no
individually significant other reconciling items.
The components of the deferred income tax assets and liabilities were as follows:
(In millions)
June 30, 2014 2013
Deferred Income Tax Assets
Stock-based compensation expense $ 903
$ 888
Other expense items 1,112 917
Unearned revenue 520
445
Impaired investments 209
246
Loss carryforwards 922
715
Other revenue items 64
55
Deferred income tax assets $ 3,730 $ 3,266
Less valuation allowance (903) (579)
Deferred income tax assets, net of valuation allowance $ 2,827 $ 2,687
Deferred Income Tax Liabilities
Foreign earnings $ (1,140) $ (1,146)
Unrealized gain on investments (1,911) (1,012)
Depreciation and amortization (470) (604)
Other (87) (2)
Deferred income tax liabilities $ (3,608) $ (2,764)
Net deferred income tax assets (liabilities) $ (781) $ (77)
Reported As
Current deferred income tax assets $ 1,941 $ 1,632
Other current liabilities (125) 0
Other long-term assets 131
0
Long-term deferred income tax liabilities (2,728) (1,709)
Net deferred income tax assets (liabilities) $ (781) $ (77)
As of June 30, 2014, we had net operating loss carryforwards of $3.6 billion, including $2.2 billion of foreign net operating
loss carryforwards acquired through our acquisition of Skype, and $545 million through our acquisition of NDS. The
valuation allowance disclosed in the table above relates to the foreign net operating loss carryforwards and other net
deferred tax assets that may not be realized.