Microsoft 2014 Annual Report Download - page 80
Download and view the complete annual report
Please find page 80 of the 2014 Microsoft annual report below. You can navigate through the pages in the report by either clicking on the pages listed below, or by using the keyword search tool below to find specific information within the annual report.-
 1
1 -
2
-
3
-
4
-
5
-
6
-
7
-
8
-
9
-
10
-
11
-
12
-
13
-
14
-
15
-
16
-
17
-
18
-
19
-
20
-
21
-
22
-
23
-
24
-
25
-
26
-
27
-
28
-
29
-
30
-
31
-
32
-
33
-
34
-
35
-
36
-
37
-
38
-
39
-
40
-
41
-
42
-
43
-
44
-
45
-
46
-
47
-
48
-
49
-
50
-
51
-
52
-
53
-
54
-
55
-
56
-
57
-
58
-
59
-
60
-
61
-
62
-
63
-
64
-
65
-
66
-
67
-
68
-
69
-
 70
70 -
 71
71 -
 72
72 -
 73
73 -
 74
74 -
 75
75 -
 76
76 -
 77
77 -
 78
78 -
 79
79 -
 80
80 -
 81
81 -
 82
82 -
 83
83 -
 84
84 -
 85
85 -
 86
86 -
 87
87 -
 88
88
 |
 |

79
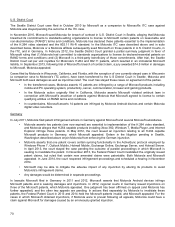
Following is operating income (loss) by segment group.
(In millions)
Y
ear Ended June 30, 2014 2013 2012
Devices and Consumer $ 8,714 $ 9,421 $ 6,051
Commercial 23,467 21,132 19,978
Corporate and Other (4,422) (3,789) (4,266)
Total operating income $ 27,759 $ 26,764 $ 21,763
Corporate and Other operating income includes adjustments to conform our internal accounting policies to U.S. GAAP
and corporate-level activity not specifically attributed to a segment. Significant internal accounting policies that differ from
U.S. GAAP relate to revenue recognition, income statement classification, and depreciation.
Corporate and Other activity was as follows:
(In millions)
Y
ear Ended June 30, 2014 2013 2012
Corporate (a) $ (3,888) $ (4,236) $ (3,671)
Other (adjustments to U.S. GAAP):
Revenue reconciling amounts (b) (415) 403 (485)
Cost of revenue reconciling amounts (79) (31) (97)
Operating expenses reconciling amounts (40) 75 (13)
Total Corporate and Other $ (4,422) $ (3,789) $ (4,266)
(a) Corporate is presented on the basis of our internal accounting policies and excludes the adjustments to U.S. GAAP
that are presented separately in those line items.
(b) Revenue reconciling amounts for fiscal year 2014 included a net $349 million of revenue deferrals related to sales of
certain devices bundled with other products and services (“Bundled Offerings”). Revenue reconciling amounts for
fiscal years 2012 and 2013 included the deferral and subsequent recognition, respectively, of $540 million of
revenue related to the Windows Upgrade Offer.
No sales to an individual customer or country other than the United States accounted for more than 10% of fiscal year
2014, 2013, or 2012 revenue. Revenue, classified by the major geographic areas in which our customers are located, was
as follows:
(In millions)
Y
ear Ended June 30, 2014 2013 2012
United States (a) $ 43,474 $ 41,344 $ 38,846
Other countries 43,359 36,505 34,877
Total $ 86,833 $ 77,849 $ 73,723
(a) Includes billings to OEMs and certain multinational organizations because of the nature of these businesses and the
impracticability of determining the geographic source of the revenue.