Microsoft 2014 Annual Report Download - page 79
Download and view the complete annual report
Please find page 79 of the 2014 Microsoft annual report below. You can navigate through the pages in the report by either clicking on the pages listed below, or by using the keyword search tool below to find specific information within the annual report.-
 1
1 -
2
-
3
-
4
-
5
-
6
-
7
-
8
-
9
-
10
-
11
-
12
-
13
-
14
-
15
-
16
-
17
-
18
-
19
-
20
-
21
-
22
-
23
-
24
-
25
-
26
-
27
-
28
-
29
-
30
-
31
-
32
-
33
-
34
-
35
-
36
-
37
-
38
-
39
-
40
-
41
-
42
-
43
-
44
-
45
-
46
-
47
-
48
-
49
-
50
-
51
-
52
-
53
-
54
-
55
-
56
-
57
-
58
-
59
-
60
-
61
-
62
-
63
-
64
-
65
-
66
-
67
-
68
-
 69
69 -
 70
70 -
 71
71 -
 72
72 -
 73
73 -
 74
74 -
 75
75 -
 76
76 -
 77
77 -
 78
78 -
 79
79 -
 80
80 -
 81
81 -
 82
82 -
 83
83 -
 84
84 -
 85
85 -
 86
86 -
 87
87 -
 88
88
 |
 |

78
Certain corporate-level activity is not allocated to our segment groups, including costs of: legal, including expenses,
settlements, and fines; information technology; human resources; finance; excise taxes; and integration and restructuring
costs.
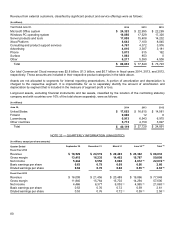
Segment revenue and gross margin were as follows during the periods presented:
(In millions)
Y
ear Ended June 30, 2014 2013 2012
Revenue
Devices and Consumer Licensing $ 18,803 $ 19,021 $ 19,495
Hardware:
Computing and Gaming Hardware 9,628 6,461 6,740
Phone Hardware 1,985 0 0
Total D&C Hardware 11,613 6,461 6,740
Other 7,258 6,618 6,203
Total Devices and Consumer 37,674 32,100 32,438
Commercial Licensing 42,027 39,686 37,126
Other 7,547 5,660 4,644
Total Commercial 49,574 45,346 41,770
Corporate and Other (415) 403 (485)
Total revenue $ 86,833 $ 77,849 $ 73,723
(In millions)
Y
ear Ended June 30, 2014 2013 2012
Gross margin
Devices and Consumer
Licensing $ 17,216 $ 17,044 $ 17,240
Hardware:
Computing and Gaming Hardware 893 956 2,495
Phone Hardware 54 0 0
Total D&C Hardware 947 956 2,495
Other 1,770 2,046 1,998
Total Devices and Consumer 19,933 20,046 21,733
Commercial Licensing 38,604 36,261 34,463
Other 1,856 921 579
Total Commercial 40,460 37,182 35,042
Corporate and Other (494) 372 (582)
Total gross margin $ 59,899 $ 57,600 $ 56,193
Following is operating expenses by segment group. As discussed above, we do not allocate operating expenses below
cost of revenue to our segments.
(In millions)
Y
ear Ended June 30, 2014 2013 2012
Devices and Consumer $ 11,219 $ 10,625 $ 15,682
Commercial 16,993 16,050 15,064
Corporate and Other 3,928 4,161 3,684
Total operating expenses $ 32,140 $ 30,836 $ 34,430