Microsoft 2014 Annual Report Download - page 59
Download and view the complete annual report
Please find page 59 of the 2014 Microsoft annual report below. You can navigate through the pages in the report by either clicking on the pages listed below, or by using the keyword search tool below to find specific information within the annual report.-
 1
1 -
2
-
3
-
4
-
5
-
6
-
7
-
8
-
9
-
10
-
11
-
12
-
13
-
14
-
15
-
16
-
17
-
18
-
19
-
20
-
21
-
22
-
23
-
24
-
25
-
26
-
27
-
28
-
29
-
30
-
31
-
32
-
33
-
34
-
35
-
36
-
37
-
38
-
39
-
40
-
41
-
42
-
43
-
44
-
45
-
46
-
47
-
48
-
 49
49 -
 50
50 -
 51
51 -
 52
52 -
 53
53 -
 54
54 -
 55
55 -
 56
56 -
 57
57 -
 58
58 -
 59
59 -
 60
60 -
 61
61 -
 62
62 -
 63
63 -
 64
64 -
 65
65 -
 66
66 -
 67
67 -
 68
68 -
 69
69 -
70
-
71
-
72
-
73
-
74
-
75
-
76
-
77
-
78
-
79
-
80
-
81
-
82
-
83
-
84
-
85
-
86
-
87
-
88
 |
 |

58
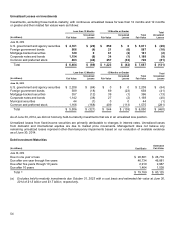
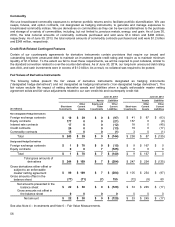
NOTE 6 — FAIR VALUE MEASUREMENTS
Assets and Liabilities Measured at Fair Value on a Recurring Basis
The following tables present the fair value of our financial instruments that are measured at fair value on a recurring basis:
(In millions) Level 1 Level 2 Level 3
Gross
Fair
Value Netting
(a) Net Fair
Value
June 30, 2014
Assets
Mutual funds $ 590 $ 0 $ 0 $ 590 $ 0 $ 590
Commercial paper 0 189 0 189 0 189
Certificates of deposit 0 1,197 0 1,197 0 1,197
U.S. government and agency securities 66,288 745 0 67,033 0 67,033
Foreign government bonds 139 3,210 0 3,349 0 3,349
Mortgage-backed securities 0 1,015 0 1,015 0 1,015
Corporate notes and bonds 0 6,863 0 6,863 0 6,863
Municipal securities 0 332 0 332 0 332
Common and preferred stock 9,552 1,825 14 11,391 0 11,391
Derivatives 5 348 7 360 (155) 205
Total $ 76,574 $ 15,724 $ 21 $ 92,319 $ (155) $ 92,164
Liabilities
Derivatives and other $ 5 $ 153 $ 126 $ 284 $ (155) $ 129
(In millions) Level 1 Level 2 Level 3
Gross
Fair
Value Netting
(a) Net Fair
Value
June 30, 2013
Assets
Mutual funds $ 868 $ 0 $ 0 $ 868 $ 0 $ 868
Commercial paper 0 603 0 603 0 603
Certificates of deposit 0 994 0 994 0 994
U.S. government and agency securities 62,237 2,664 0 64,901 0 64,901
Foreign government bonds 9 851 0 860 0 860
Mortgage-backed securities 0 1,311 0 1,311 0 1,311
Corporate notes and bonds 0 4,915 19 4,934 0 4,934
Municipal securities 0 385 0 385 0 385
Common and preferred stock 8,470 717 5 9,192 0 9,192
Derivatives 12 489 0 501 (81) 420
Total $ 71,596 $ 12,929 $ 24 $ 84,549 $ (81) $ 84,468
Liabilities
Derivatives and other $ 14 $ 121 $ 0 $ 135 $ (80) $ 55
(a) These amounts represent the impact of netting derivative assets and derivative liabilities when a legally enforceable
master netting agreement exists and fair value adjustments related to our own credit risk and counterparty credit
risk.
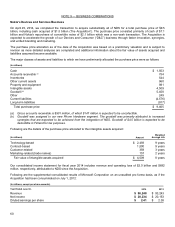
In connection with the transaction to acquire substantially all of Nokia Corporation’s (“Nokia”) Devices and Services
Business (“NDS”), on September 23, 2013 we provided Nokia €1.5 billion ($2.1 billion) principal of convertible notes
classified as Level 3 financial instruments. Upon closing of the acquisition, Nokia repurchased these notes at their
principal amount plus accrued interest. All other changes in our Level 3 financial instruments that are measured at fair
value on a recurring basis were immaterial during the periods presented.