Microsoft 2014 Annual Report Download - page 23
Download and view the complete annual report
Please find page 23 of the 2014 Microsoft annual report below. You can navigate through the pages in the report by either clicking on the pages listed below, or by using the keyword search tool below to find specific information within the annual report.-
 1
1 -
2
-
3
-
4
-
5
-
6
-
7
-
8
-
9
-
10
-
11
-
12
-
 13
13 -
 14
14 -
 15
15 -
 16
16 -
 17
17 -
 18
18 -
 19
19 -
 20
20 -
 21
21 -
 22
22 -
 23
23 -
 24
24 -
 25
25 -
 26
26 -
 27
27 -
 28
28 -
 29
29 -
 30
30 -
 31
31 -
 32
32 -
 33
33 -
34
-
35
-
36
-
37
-
38
-
39
-
40
-
41
-
42
-
43
-
44
-
45
-
46
-
47
-
48
-
49
-
50
-
51
-
52
-
53
-
54
-
55
-
56
-
57
-
58
-
59
-
60
-
61
-
62
-
63
-
64
-
65
-
66
-
67
-
68
-
69
-
70
-
71
-
72
-
73
-
74
-
75
-
76
-
77
-
78
-
79
-
80
-
81
-
82
-
83
-
84
-
85
-
86
-
87
-
88
 |
 |

22
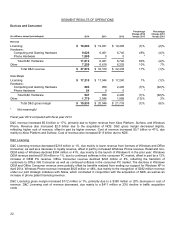
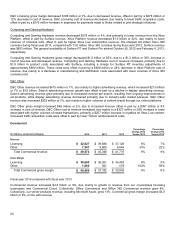
SEGMENT RESULTS OF OPERATIONS
Devices and Consumer
(In millions, except percentages) 2014 2013 2012
Percentage
Change 2014
Versus 2013
Percentage
Change 2013
Versus 2012
Revenue
Licensing $ 18,803 $ 19,021 $ 19,495 (1)% (2)%
Hardware:
Computing and Gaming Hardware 9,628
6,461 6,740 49% (4)%
Phone Hardware 1,985
0 0 * *
Total D&C Hardware 11,613 6,461 6,740 80% (4)%
Other 7,258
6,618 6,203 10% 7%
Total D&C revenue $ 37,674 $ 32,100 $ 32,438 17% (1)%
Gross Margin
Licensing $ 17,216 $ 17,044 $ 17,240 1% (1)%
Hardware:
Computing and Gaming Hardware 893
956 2,495 (7)% (62)%
Phone Hardware 54
0 0 * *
Total D&C Hardware 947
956 2,495 (1)% (62)%
Other 1,770
2,046 1,998 (13)% 2%
Total D&C gross margin $ 19,933 $ 20,046 $ 21,733 (1)% (8)%
* Not meaningful
Fiscal year 2014 compared with fiscal year 2013
D&C revenue increased $5.6 billion or 17%, primarily due to higher revenue from Xbox Platform, Surface, and Windows
Phone. Revenue also increased $2.0 billion due to the acquisition of NDS. D&C gross margin decreased slightly,
reflecting higher cost of revenue, offset in part by higher revenue. Cost of revenue increased $5.7 billion or 47%, due
mainly to Xbox Platform and Surface. Cost of revenue also increased $1.9 billion due to NDS.
D&C Licensing
D&C Licensing revenue decreased $218 million or 1%, due mainly to lower revenue from licenses of Windows and Office
Consumer, as well as a decrease in royalty revenue, offset in part by increased Windows Phone revenue. Retail and non-
OEM sales of Windows declined $304 million or 41%, due mainly to the launch of Windows 8 in the prior year. Windows
OEM revenue declined $136 million or 1%, due to continued softness in the consumer PC market, offset in part by a 12%
increase in OEM Pro revenue. Office Consumer revenue declined $243 million or 8%, reflecting the transition of
customers to Office 365 Consumer as well as continued softness in the consumer PC market. The declines in Windows
OEM and Office Consumer revenue were partially offset by benefits realized from ending our support for Windows XP in
April 2014. Windows Phone revenue increased $822 million or 48%, due mainly to the recognition of $382 million revenue
under our joint strategic initiatives with Nokia, which concluded in conjunction with the acquisition of NDS, as well as an
increase in phone patent licensing revenue.
D&C Licensing gross margin increased $172 million or 1%, primarily due to a $390 million or 20% decrease in cost of
revenue. D&C Licensing cost of revenue decreased, due mainly to a $411 million or 23% decline in traffic acquisition
costs.