Microsoft 2014 Annual Report Download - page 81
Download and view the complete annual report
Please find page 81 of the 2014 Microsoft annual report below. You can navigate through the pages in the report by either clicking on the pages listed below, or by using the keyword search tool below to find specific information within the annual report.-
 1
1 -
2
-
3
-
4
-
5
-
6
-
7
-
8
-
9
-
10
-
11
-
12
-
13
-
14
-
15
-
16
-
17
-
18
-
19
-
20
-
21
-
22
-
23
-
24
-
25
-
26
-
27
-
28
-
29
-
30
-
31
-
32
-
33
-
34
-
35
-
36
-
37
-
38
-
39
-
40
-
41
-
42
-
43
-
44
-
45
-
46
-
47
-
48
-
49
-
50
-
51
-
52
-
53
-
54
-
55
-
56
-
57
-
58
-
59
-
60
-
61
-
62
-
63
-
64
-
65
-
66
-
67
-
68
-
69
-
70
-
 71
71 -
 72
72 -
 73
73 -
 74
74 -
 75
75 -
 76
76 -
 77
77 -
 78
78 -
 79
79 -
 80
80 -
 81
81 -
 82
82 -
 83
83 -
 84
84 -
 85
85 -
 86
86 -
 87
87 -
 88
88
 |
 |

80
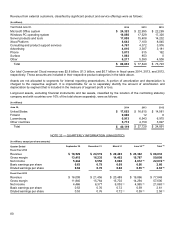
Revenue from external customers, classified by significant product and service offerings were as follows:
(In millions)
Y
ear Ended June 30, 2014 2013 2012
Microsoft Office system $ 24,323 $ 22,995 $ 22,299
Windows PC operating system 16,856 17,529 17,320
Server products and tools 17,055 15,408 14,232
Xbox Platform 8,643 7,100 8,045
Consulting and product support services 4,767 4,372 3,976
Advertising 4,016 3,387 3,181
Phone 3,073 615 162
Surface 1,883 853 0
Other 6,217 5,590 4,508
Total $ 86,833 $ 77,849 $ 73,723
Our total Commercial Cloud revenue was $2.8 billion, $1.3 billion, and $0.7 billion in fiscal years 2014, 2013, and 2012,
respectively. These amounts are included in their respective product categories in the table above.
Assets are not allocated to segments for internal reporting presentations. A portion of amortization and depreciation is
charged to the respective segment. It is impracticable for us to separately identify the amount of amortization and
depreciation by segment that is included in the measure of segment profit or loss.
Long-lived assets, excluding financial instruments and tax assets, classified by the location of the controlling statutory
company and with countries over 10% of the total shown separately, were as follows:
(In millions)
June 30, 2014 2013 2012
United States $ 17,653 $ 16,615 $ 14,081
Finland 9,840 12 8
Luxembourg 6,913 6,943 6,975
Other countries 5,713 4,159 3,827
Total $ 40,119 $ 27,729 $ 24,891
NOTE 22 — QUARTERLY INFORMATION (UNAUDITED)
(In millions, except per share amounts)
Quarter Ended September 30 December 31 March 31 June 30
(
a
)
Total
(
a
)
Fiscal Year 2014
Revenue $ 18,529 $ 24,519 $ 20,403 $ 23,382 $ 86,833
Gross margin 13,415 16,235 14,462 15,787 59,899
Net income 5,244 6,558 5,660 4,612
(b) 22,074
(b)
Basic earnings per share 0.63 0.79 0.68 0.56 2.66
Diluted earnings per share 0.62 0.78 0.68 0.55
(b) 2.63
(b)
Fiscal Year 2013
Revenue $ 16,008 $ 21,456 $ 20,489 $ 19,896 $ 77,849
Gross margin 11,840 15,764 15,702 14,294 57,600
Net income 4,466 6,377 6,055
(c) 4,965
(d) 21,863
(e)
Basic earnings per share 0.53 0.76 0.72 0.59 2.61
Diluted earnings per share 0.53 0.76 0.72
(c) 0.59
(d) 2.58
(e)