Microsoft 2014 Annual Report Download - page 33
Download and view the complete annual report
Please find page 33 of the 2014 Microsoft annual report below. You can navigate through the pages in the report by either clicking on the pages listed below, or by using the keyword search tool below to find specific information within the annual report.-
 1
1 -
2
-
3
-
4
-
5
-
6
-
7
-
8
-
9
-
10
-
11
-
12
-
13
-
14
-
15
-
16
-
17
-
18
-
19
-
20
-
21
-
22
-
 23
23 -
 24
24 -
 25
25 -
 26
26 -
 27
27 -
 28
28 -
 29
29 -
 30
30 -
 31
31 -
 32
32 -
 33
33 -
 34
34 -
 35
35 -
 36
36 -
 37
37 -
 38
38 -
 39
39 -
 40
40 -
 41
41 -
 42
42 -
 43
43 -
44
-
45
-
46
-
47
-
48
-
49
-
50
-
51
-
52
-
53
-
54
-
55
-
56
-
57
-
58
-
59
-
60
-
61
-
62
-
63
-
64
-
65
-
66
-
67
-
68
-
69
-
70
-
71
-
72
-
73
-
74
-
75
-
76
-
77
-
78
-
79
-
80
-
81
-
82
-
83
-
84
-
85
-
86
-
87
-
88
 |
 |
32
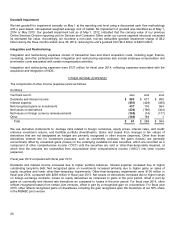
Debt
We issued debt to take advantage of favorable pricing and liquidity in the debt markets, reflecting our credit rating and the
low interest rate environment. The proceeds of these issuances were or will be used for general corporate purposes,
which may include, among other things, funding for working capital, capital expenditures, repurchases of capital stock,
acquisitions, and repayment of existing debt.
As of June 30, 2014, we had $22.6 billion of issued and outstanding debt, comprising $2.0 billion of short-term debt and
$20.6 billion of long-term debt.
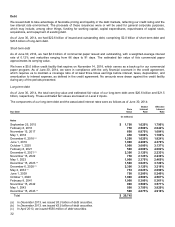
Short-term debt
As of June 30, 2014, we had $2.0 billion of commercial paper issued and outstanding, with a weighted-average interest
rate of 0.12% and maturities ranging from 86 days to 91 days. The estimated fair value of this commercial paper
approximates its carrying value.
We have a $5.0 billion credit facility that expires on November 14, 2018, which serves as a back-up for our commercial
paper program. As of June 30, 2014, we were in compliance with the only financial covenant in the credit agreement,
which requires us to maintain a coverage ratio of at least three times earnings before interest, taxes, depreciation, and
amortization to interest expense, as defined in the credit agreement. No amounts were drawn against the credit facility
during any of the periods presented.
Long-term debt
As of June 30, 2014, the total carrying value and estimated fair value of our long-term debt were $20.6 billion and $21.5
billion, respectively. These estimated fair values are based on Level 2 inputs.
The components of our long-term debt and the associated interest rates were as follows as of June 30, 2014:
Due Date Face
Value
Stated
Interest
Rate
Effective
Interest
Rate
(In millions)
Notes
September 25, 2015 $ 1,750 1.625% 1.795%
February 8, 2016 750 2.500% 2.642%
November 15, 2017 600 0.875% 1.084%
May 1, 2018 450 1.000% 1.106%
December 6, 2018 (a) 1,250 1.625% 1.824%
June 1, 2019 1,000 4.200% 4.379%
October 1, 2020 1,000 3.000% 3.137%
February 8, 2021 500 4.000% 4.082%
December 6, 2021 (b) 2,396 2.125% 2.233%
November 15, 2022 750 2.125% 2.239%
May 1, 2023 1,000 2.375% 2.465%
December 15, 2023 (a) 1,500 3.625% 3.726%
December 6, 2028 (b) 2,396 3.125% 3.218%
May 2, 2033 (c) 753 2.625% 2.690%
June 1, 2039 750 5.200% 5.240%
October 1, 2040 1,000 4.500% 4.567%
February 8, 2041 1,000 5.300% 5.361%
November 15, 2042 900 3.500% 3.571%
May 1, 2043 500 3.750% 3.829%
December 15, 2043 (a) 500 4.875% 4.918%
Total $ 20,745
(a) In December 2013, we issued $3.3 billion of debt securities.
(b) In December 2013, we issued €3.5 billion of debt securities.
(c) In April 2013, we issued €550 million of debt securities.