Sony 1999 Annual Report Download - page 34
Download and view the complete annual report
Please find page 34 of the 1999 Sony annual report below. You can navigate through the pages in the report by either clicking on the pages listed below, or by using the keyword search tool below to find specific information within the annual report.-
 1
1 -
2
-
3
-
4
-
5
-
6
-
7
-
8
-
9
-
10
-
11
-
12
-
13
-
14
-
15
-
16
-
17
-
18
-
19
-
20
-
21
-
22
-
23
-
 24
24 -
 25
25 -
 26
26 -
 27
27 -
 28
28 -
 29
29 -
 30
30 -
 31
31 -
 32
32 -
 33
33 -
 34
34 -
 35
35 -
 36
36 -
 37
37 -
 38
38 -
 39
39 -
 40
40 -
 41
41 -
 42
42 -
 43
43 -
 44
44 -
45
-
46
-
47
-
48
-
49
-
50
-
51
-
52
-
53
-
54
-
55
-
56
-
57
-
58
-
59
-
60
-
61
-
62
-
63
-
64
-
65
-
66
-
67
-
68
-
69
-
70
-
71
-
72
-
73
-
74
-
75
-
76
-
77
-
78
-
79
-
80
-
81
 |
 |

Sony Corporation Annual Report 1999
32
page
estimates are obtained by applying the yen’s average ex-
change rate in the previous fiscal year to foreign currency-
denominated sales, cost of sales, and selling, general and
administrative expenses of the fiscal year. Constant cur-
rency basis comparisons discussed in the Results by Busi-
ness Segment below are also calculated in the same way as
above.) However, the high volatility of the yen exchange
rate made it difficult to manage global procurement of
materials, manufacturing, and sales activities as planned,
and adversely affected Sony’s business results, particularly
for the second half of the fiscal year.
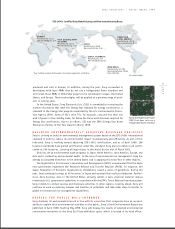
Sony employs foreign exchange forward contracts and
foreign currency option contracts to hedge against foreign
exchange risks that arise from its export and import trans-
actions. Furthermore, particularly in the Electronics busi-
ness, to minimize the adverse effects of foreign exchange
fluctuations on its financial results and to reduce inventory
and cost, Sony seeks, when appropriate, to localize mate-
rial and parts procurement, design, and manufacturing op-
erations outside Japan.
Sales
During the year, sales rose by 39.1 billion yen, or 0.6%, to
6,794.6 billion yen compared with the previous fiscal year.
Cost of Sales and Selling, General and Administrative
Expenses (Excluding the Insurance Business)
During the year, cost of sales rose by 14.8 billion yen, or
0.3%, to 4,633.8 billion yen and the ratio of cost of sales to
consolidated sales increased from 71.5% to 71.8%, prima-
rily due to increases in research and development, person-
nel, and depreciation and amortization expenses. These
increases were partially offset by decreases in expenses
resulting from lower production volume. Research and
development expenses increased by 57.3 billion yen, or
18.0%, to 375.3 billion yen, principally for technologies
related to the next generation game console, semicon-
ductors, broadcast-use equipment, and digital networks, and
rose from 4.9% to 5.8% as a percentage of sales.
Selling, general and administrative expenses increased
by 155.3 billion yen, or 11.5%, to 1,500.9 billion yen, and
rose from 20.8% to 23.3% as a percentage of sales. This
was primarily due to increases in advertising, personnel,
and service expenses.
Operating Income
Operating income during the year declined by 181.6 billion
yen, or 34.9%, to 338.6 billion yen. Operating margin de-
creased from 7.7% to 5.0%.
Other Income and Expenses
Other income increased by 68.9 billion yen, or 82.1%, to
152.9 billion yen, while other expenses decreased by 27.0
billion yen, or 17.9%, to 123.4 billion yen.
The large increase in other income principally represents
a 58.7 billion yen gain on securities contribution to em-
ployee retirement benefit trust. Sony Corporation contrib-
uted marketable equity securities to an outside trust for
employee retirement benefit purposes and realized the gain.
In addition, Sony recorded a 5.2 billion yen gain resulting
from the merger of the Theatrical exhibition group in the
Pictures business with Cineplex Odeon Corporation. Interest
and dividends income also increased by 2.3 billion yen, or
11.1%, to 23.3 billion yen, principally because of an in-
crease in the average outstanding balances of cash and time
deposits and marketable securities at subsidiaries princi-
pally outside Japan.
Sales and Operating Revenue*
(Billion ¥) Net Income*
(Billion ¥) Net Income per Share (Diluted)*
(¥)
97 98 99
5,663 6,755 6,795
97 98 99
139 222 179
97 98 99
309 483 391
*Year ended March 31