Sony 1999 Annual Report Download - page 73
Download and view the complete annual report
Please find page 73 of the 1999 Sony annual report below. You can navigate through the pages in the report by either clicking on the pages listed below, or by using the keyword search tool below to find specific information within the annual report.-
 1
1 -
2
-
3
-
4
-
5
-
6
-
7
-
8
-
9
-
10
-
11
-
12
-
13
-
14
-
15
-
16
-
17
-
18
-
19
-
20
-
21
-
22
-
23
-
24
-
25
-
26
-
27
-
28
-
29
-
30
-
31
-
32
-
33
-
34
-
35
-
36
-
37
-
38
-
39
-
40
-
41
-
42
-
43
-
44
-
45
-
46
-
47
-
48
-
49
-
50
-
51
-
52
-
53
-
54
-
55
-
56
-
57
-
58
-
59
-
60
-
61
-
62
-
 63
63 -
 64
64 -
 65
65 -
 66
66 -
 67
67 -
 68
68 -
 69
69 -
 70
70 -
 71
71 -
 72
72 -
 73
73 -
 74
74 -
 75
75 -
 76
76 -
 77
77 -
 78
78 -
 79
79 -
 80
80 -
 81
81
 |
 |

71
page
Sony Corporation Annual Report 1999
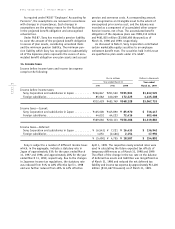
Business segments
Sales and operating revenue:
Yen in millions Dollars in thousands
Year ended March 31 Year ended
1997 1998 1999 March 31, 1999
Sales and operating revenue:
Electronics —
Customers . . . . . . . . . . . . . . . . . . . . . . . ¥3,930,292 ¥4,377,346 ¥4,355,001 $36,291,675
Intersegment . . . . . . . . . . . . . . . . . . . . . 201,339 312,764 313,448 2,612,067
Total . . . . . . . . . . . . . . . . . . . . . . . . . 4,131,631 4,690,110 4,668,449 38,903,742
Game —
Customers . . . . . . . . . . . . . . . . . . . . . . . 408,335 699,574 760,071 6,333,925
Intersegment . . . . . . . . . . . . . . . . . . . . . 10,943 22,977 23,751 197,925
Total . . . . . . . . . . . . . . . . . . . . . . . . . 419,278 722,551 783,822 6,531,850
Music —
Customers . . . . . . . . . . . . . . . . . . . . . . . 570,119 660,407 718,878 5,990,650
Intersegment . . . . . . . . . . . . . . . . . . . . . 21,961 34,307 41,394 344,950
Total . . . . . . . . . . . . . . . . . . . . . . . . . 592,080 694,714 760,272 6,335,600
Pictures —
Customers . . . . . . . . . . . . . . . . . . . . . . . 438,551 642,714 540,109 4,500,908
Intersegment . . . . . . . . . . . . . . . . . . . . . 3 450 59 492
Total . . . . . . . . . . . . . . . . . . . . . . . . . 438,554 643,164 540,168 4,501,400
Insurance —
Customers . . . . . . . . . . . . . . . . . . . . . . . 227,920 291,061 339,368 2,828,067
Intersegment . . . . . . . . . . . . . . . . . . . . . 14 7 18
Total . . . . . . . . . . . . . . . . . . . . . . . . . 227,934 291,068 339,369 2,828,075
Other —
Customers . . . . . . . . . . . . . . . . . . . . . . . 87,917 84,388 81,192 676,600
Intersegment . . . . . . . . . . . . . . . . . . . . . 152,457 163,841 206,137 1,717,808
Total . . . . . . . . . . . . . . . . . . . . . . . . . 240,374 248,229 287,329 2,394,408
Elimination . . . . . . . . . . . . . . . . . . . . . . . . (386,717) (534,346) (584,790) (4,873,250)
Consolidated total . . . . . . . . . . . . . . . . . . . . . ¥5,663,134 ¥6,755,490 ¥6,794,619 $56,621,825
Yen in millions Dollars in thousands
Year ended March 31 Year ended
1997 1998 1999 March 31, 1999
Equity earnings (losses) included in sales
and operating revenue:
Electronics . . . . . . . . . . . . . . . . . . . . . . . . ¥ (322) ¥(2,738) ¥(1,253) $(10,442)
Music . . . . . . . . . . . . . . . . . . . . . . . . . . . . 5,755 2,026 1,581 13,175
Pictures . . . . . . . . . . . . . . . . . . . . . . . . . . 152 (1,469) (5,584) (46,533)
Other . . . . . . . . . . . . . . . . . . . . . . . . . . . . (704) (3,333) (4,307) (35,892)
Total . . . . . . . . . . . . . . . . . . . . . . . . . ¥4,881 ¥(5,514) ¥(9,563) $(79,692)