Sony 1999 Annual Report Download - page 35
Download and view the complete annual report
Please find page 35 of the 1999 Sony annual report below. You can navigate through the pages in the report by either clicking on the pages listed below, or by using the keyword search tool below to find specific information within the annual report.-
 1
1 -
2
-
3
-
4
-
5
-
6
-
7
-
8
-
9
-
10
-
11
-
12
-
13
-
14
-
15
-
16
-
17
-
18
-
19
-
20
-
21
-
22
-
23
-
24
-
 25
25 -
 26
26 -
 27
27 -
 28
28 -
 29
29 -
 30
30 -
 31
31 -
 32
32 -
 33
33 -
 34
34 -
 35
35 -
 36
36 -
 37
37 -
 38
38 -
 39
39 -
 40
40 -
 41
41 -
 42
42 -
 43
43 -
 44
44 -
 45
45 -
46
-
47
-
48
-
49
-
50
-
51
-
52
-
53
-
54
-
55
-
56
-
57
-
58
-
59
-
60
-
61
-
62
-
63
-
64
-
65
-
66
-
67
-
68
-
69
-
70
-
71
-
72
-
73
-
74
-
75
-
76
-
77
-
78
-
79
-
80
-
81
 |
 |

Sony Corporation Annual Report 1999
33
page
To hedge risks from exchange rate fluctuations, Sony
primarily employs foreign exchange forward contracts and
foreign currency option contracts. Foreign exchange gain,
net, decreased by 7.2 billion yen, or 71.3%, to 2.9 billion
yen, as subsidiaries principally in Asia recorded foreign ex-
change losses while Sony Corporation and certain subsidiar-
ies in Japan recorded foreign exchange gains.
The decrease in other expenses is principally due to the
decrease in interest expenses. Interest expenses decreased
by 14.2 billion yen, or 22.8%, to 48.3 billion yen, due princi-
pally to a decline in the average outstanding balance of debt
in the U.S. As a result, the balance of interest and dividends
income, less interest expense, improved by 16.6 billion yen
and net interest expense came to 25.0 billion yen.
Income before Income Taxes
Income before income taxes during the year declined by
85.6 billion yen, or 18.9%, to 368.1 billion yen.
Income Taxes
Income taxes decreased by 37.9 billion yen, or 17.6%, to
177.0 billion yen, while the percentage of income taxes to
income before income taxes (the effective tax rate) rose
from 47.4% to 48.1%. The recalculation of deferred tax
liabilities to reflect a reduction in the Japanese corporate
statutory income tax rate effective April 1, 1999 caused a
tax benefit of 13.4 billion yen, which had the effect of low-
ering the effective tax rate by 3.6 percentage points. How-
ever, the effective tax rate increased compared to the
previous year due primarily to losses at certain electronics
and music subsidiaries for which there was no tax benefit.
Deferred tax assets are recognized on operating loss
carryforwards for tax purposes since these losses may reduce
future taxable income. However, a valuation allowance is
established against those deferred tax assets that are not
expected to be realized because sufficient taxable income
is not expected to be generated before those loss carry-
forwards expire. Sony has recognized a valuation allowance
for deferred tax assets mainly relating to operating loss
carryforwards of consolidated subsidiaries in the U.S.
Net Income
Net income fell by 43.1 billion yen, or 19.4%, to 179.0 billion
yen. As a percentage of sales, net income decreased from
3.3% to 2.6%, and the return on stockholders’ equity (using
the average of such amounts at March 31, 1998 and at March
31, 1999) decreased from 13.6% to 9.8%. Net income in-
cludes 30.7 billion yen (net of tax) for the aforementioned
gain on securities contribution to employee retirement benefit
trust which was recorded in other income.
Basic net income per share was 436.9 yen compared to
557.7 yen in the previous fiscal year, and diluted net income
per share was 391.0 yen compared to 483.4 yen in the pre-
vious fiscal year.
Results by Business Segment
The following discussion is based on segment information.
Sales in each business segment include intersegment trans-
actions. In the Electronics business, sales and operating
revenue by product category represent sales to customers,
which do not include intersegment transactions (Refer to
Note 19 of Notes to Consolidated Financial Statements).
Electronics
During the year, sales in the Electronics business declined
by 21.7 billion yen, or 0.5%, to 4,668.4 billion yen. Operat-
ing income also declined by 184.7 billion yen, or 58.7%, to
129.9 billion yen (down approximately 3% and 78%, re-
spectively, on a constant currency basis), and operating
margin was 2.8%, down from 6.7%.
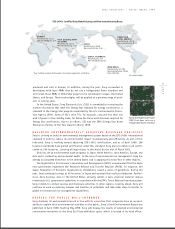
The lower sales were primarily attributable to intensi-
fied price competition in many product categories and lower
sales due to weak economic conditions in Asia, Russia and
Eastern Europe, and Latin America. By area, sales increased
in Japan and slightly increased in the U.S. and in Western
Europe, while sales sharply declined in Asia, Russia and East-
ern Europe, and Latin America.
The large decline in operating income was principally
attributable to sluggish sales and increases in cost of sales
and selling, general and administrative expenses. In cost of
sales, research and development expenses, principally for
technologies related to semiconductors, broadcast-use equip-
ment, and digital networks, personnel expenses, and depre-
ciation of production equipment of semiconductors
increased. In selling, general and administrative expenses,
personnel, advertising, and service expenses increased. These
cost increases had a substantial negative impact on profit-
ability in the Electronics business. In addition, aggressive
reductions in production in the second half of the year for
the purpose of inventory reductions further deteriorated gross
profit margins. By product category, a large profit in home-
use camcorders was offset by significant losses in cellular
phones, computer displays, and semiconductors.