Sony 1999 Annual Report Download - page 48
Download and view the complete annual report
Please find page 48 of the 1999 Sony annual report below. You can navigate through the pages in the report by either clicking on the pages listed below, or by using the keyword search tool below to find specific information within the annual report.-
 1
1 -
2
-
3
-
4
-
5
-
6
-
7
-
8
-
9
-
10
-
11
-
12
-
13
-
14
-
15
-
16
-
17
-
18
-
19
-
20
-
21
-
22
-
23
-
24
-
25
-
26
-
27
-
28
-
29
-
30
-
31
-
32
-
33
-
34
-
35
-
36
-
37
-
 38
38 -
 39
39 -
 40
40 -
 41
41 -
 42
42 -
 43
43 -
 44
44 -
 45
45 -
 46
46 -
 47
47 -
 48
48 -
 49
49 -
 50
50 -
 51
51 -
 52
52 -
 53
53 -
 54
54 -
 55
55 -
 56
56 -
 57
57 -
 58
58 -
59
-
60
-
61
-
62
-
63
-
64
-
65
-
66
-
67
-
68
-
69
-
70
-
71
-
72
-
73
-
74
-
75
-
76
-
77
-
78
-
79
-
80
-
81
 |
 |

46
page
Sony Corporation Annual Report 1999
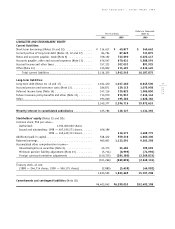
Consolidated Balance Sheets
Sony Corporation and Consolidated Subsidiaries •March 31
Dollars in thousands
Yen in millions (Note 3)
1998 1999 1999
ASSETS
Current assets:
Cash and cash equivalents (Note 12) . . . . . . . . . . . . . . . . . . . ¥ 423,286 ¥ 592,210 $ 4,935,083
Time deposits (Note 12) . . . . . . . . . . . . . . . . . . . . . . . . . . . . 107,139 24,304 202,533
Marketable securities (Note 9) . . . . . . . . . . . . . . . . . . . . . . . 169,209 117,857 982,142
Notes and accounts receivable, trade (Note 8). . . . . . . . . . . . . 1,230,799 1,135,598 9,463,317
Allowance for doubtful accounts and sales returns . . . . . . . . . . (114,911) (122,015) (1,016,792)
Inventories (Note 7) . . . . . . . . . . . . . . . . . . . . . . . . . . . . . . 993,927 877,898 7,315,817
Deferred income taxes (Note 14) . . . . . . . . . . . . . . . . . . . . . . 121,189 102,588 854,900
Prepaid expenses and other current assets . . . . . . . . . . . . . . . 336,839 340,953 2,841,275
Total current assets . . . . . . . . . . . . . . . . . . . . . . . . . . . 3,267,477 3,069,393 25,578,275
Noncurrent inventories—film (Note 7). . . . . . . . . . . . . . . . . 249,066 244,537 2,037,808
Investments and advances:
Affiliated companies . . . . . . . . . . . . . . . . . . . . . . . . . . . . . . 65,912 116,786 973,217
Securities investments and other (Note 9) . . . . . . . . . . . . . . . 784,550 863,950 7,199,583
850,462 980,736 8,172,800
Property, plant and equipment (Notes 10 and 17):
Land . . . . . . . . . . . . . . . . . . . . . . . . . . . . . . . . . . . . . . . . . 184,427 191,434 1,595,283
Buildings . . . . . . . . . . . . . . . . . . . . . . . . . . . . . . . . . . . . . . 864,324 781,876 6,515,633
Machinery and equipment . . . . . . . . . . . . . . . . . . . . . . . . . . . 1,947,454 1,952,276 16,268,967
Construction in progress. . . . . . . . . . . . . . . . . . . . . . . . . . . . 95,799 76,736 639,467
3,092,004 3,002,322 25,019,350
Less—Accumulated depreciation . . . . . . . . . . . . . . . . . . . . . . 1,744,877 1,752,571 14,604,758
1,347,127 1,249,751 10,414,592
Other assets:
Intangibles, net (Notes 5 and 13) . . . . . . . . . . . . . . . . . . . . . 124,817 123,272 1,027,267
Goodwill, net (Note 5) . . . . . . . . . . . . . . . . . . . . . . . . . . . . . 160,491 139,888 1,165,733
Deferred insurance acquisition costs (Note 11). . . . . . . . . . . . . 163,120 199,868 1,665,567
Other (Note 14) . . . . . . . . . . . . . . . . . . . . . . . . . . . . . . . . . 240,483 291,608 2,430,066
688,911 754,636 6,288,633
¥6,403,043 ¥6,299,053 $52,492,108
The accompanying notes are an integral part of these statements.