Sony 1999 Annual Report Download - page 75
Download and view the complete annual report
Please find page 75 of the 1999 Sony annual report below. You can navigate through the pages in the report by either clicking on the pages listed below, or by using the keyword search tool below to find specific information within the annual report.-
 1
1 -
2
-
3
-
4
-
5
-
6
-
7
-
8
-
9
-
10
-
11
-
12
-
13
-
14
-
15
-
16
-
17
-
18
-
19
-
20
-
21
-
22
-
23
-
24
-
25
-
26
-
27
-
28
-
29
-
30
-
31
-
32
-
33
-
34
-
35
-
36
-
37
-
38
-
39
-
40
-
41
-
42
-
43
-
44
-
45
-
46
-
47
-
48
-
49
-
50
-
51
-
52
-
53
-
54
-
55
-
56
-
57
-
58
-
59
-
60
-
61
-
62
-
63
-
64
-
 65
65 -
 66
66 -
 67
67 -
 68
68 -
 69
69 -
 70
70 -
 71
71 -
 72
72 -
 73
73 -
 74
74 -
 75
75 -
 76
76 -
 77
77 -
 78
78 -
 79
79 -
 80
80 -
 81
81
 |
 |

73
page
Sony Corporation Annual Report 1999
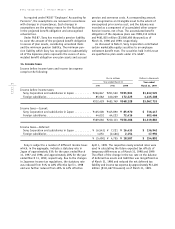
Other significant items:
Yen in millions Dollars in thousands
Year ended March 31 Year ended
1997 1998 1999 March 31, 1999
Depreciation and amortization:
Electronics . . . . . . . . . . . . . . . . . . . . . . . . ¥187,960 ¥197,449 ¥218,608 $1,821,734
Game . . . . . . . . . . . . . . . . . . . . . . . . . . . . 3,738 12,536 3,895 32,458
Music . . . . . . . . . . . . . . . . . . . . . . . . . . . . 28,707 30,933 34,523 287,692
Pictures . . . . . . . . . . . . . . . . . . . . . . . . . . 13,286 16,668 11,329 94,408
Insurance, including deferred insurance
acquisition costs . . . . . . . . . . . . . . . . . . . 15,870 22,410 21,085 175,708
Other . . . . . . . . . . . . . . . . . . . . . . . . . . . . 14,141 17,539 15,402 128,350
Total. . . . . . . . . . . . . . . . . . . . . . . . . . . 263,702 297,535 304,842 2,540,350
Corporate . . . . . . . . . . . . . . . . . . . . . . . . . 2,830 4,130 2,331 19,425
Consolidated total . . . . . . . . . . . . . . . . . . . . . ¥266,532 ¥301,665 ¥307,173 $2,559,775
Capital expenditures for segment assets:
Electronics . . . . . . . . . . . . . . . . . . . . . . . . ¥226,696 ¥301,197 ¥252,363 $2,103,025
Game . . . . . . . . . . . . . . . . . . . . . . . . . . . . 5,757 17,114 3,941 32,842
Music . . . . . . . . . . . . . . . . . . . . . . . . . . . . 31,807 28,361 45,222 376,850
Pictures . . . . . . . . . . . . . . . . . . . . . . . . . . 15,194 13,477 10,747 89,558
Insurance . . . . . . . . . . . . . . . . . . . . . . . . . 176 633 836 6,967
Other . . . . . . . . . . . . . . . . . . . . . . . . . . . . 16,502 24,102 36,574 304,783
Total. . . . . . . . . . . . . . . . . . . . . . . . . . . 296,132 384,884 349,683 2,914,025
Corporate . . . . . . . . . . . . . . . . . . . . . . . . . 1,946 3,071 4,047 33,725
Consolidated total . . . . . . . . . . . . . . . . . . . . . ¥298,078 ¥387,955 ¥353,730 $2,947,750
The capital expenditures in the above table represent
the additions to fixed assets of each segment.
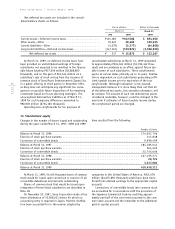
The following table is a breakdown of Electronics
sales and operating revenue to external customers by
product category. The Electronics business is managed
as a single operating segment by Sony’s management.
Yen in millions Dollars in thousands
Year ended March 31 Year ended
1997 1998 1999 March 31, 1999
Audio . . . . . . . . . . . . . . . . . . . . . . . . . . . . . ¥1,029,961 ¥1,127,788 ¥1,072,621 $ 8,938,508
Video. . . . . . . . . . . . . . . . . . . . . . . . . . . . . . 816,582 870,854 969,129 8,076,075
Televisions . . . . . . . . . . . . . . . . . . . . . . . . . . 704,075 709,043 702,620 5,855,167
Information and Communications . . . . . . . . . . 764,512 894,810 914,140 7,617,833
Electronic components and other. . . . . . . . . . . 615,162 774,851 696,491 5,804,092
Total. . . . . . . . . . . . . . . . . . . . . . . . . . . ¥3,930,292 ¥4,377,346 ¥4,355,001 $36,291,675