Sony 1999 Annual Report Download - page 45
Download and view the complete annual report
Please find page 45 of the 1999 Sony annual report below. You can navigate through the pages in the report by either clicking on the pages listed below, or by using the keyword search tool below to find specific information within the annual report.-
 1
1 -
2
-
3
-
4
-
5
-
6
-
7
-
8
-
9
-
10
-
11
-
12
-
13
-
14
-
15
-
16
-
17
-
18
-
19
-
20
-
21
-
22
-
23
-
24
-
25
-
26
-
27
-
28
-
29
-
30
-
31
-
32
-
33
-
34
-
 35
35 -
 36
36 -
 37
37 -
 38
38 -
 39
39 -
 40
40 -
 41
41 -
 42
42 -
 43
43 -
 44
44 -
 45
45 -
 46
46 -
 47
47 -
 48
48 -
 49
49 -
 50
50 -
 51
51 -
 52
52 -
 53
53 -
 54
54 -
 55
55 -
56
-
57
-
58
-
59
-
60
-
61
-
62
-
63
-
64
-
65
-
66
-
67
-
68
-
69
-
70
-
71
-
72
-
73
-
74
-
75
-
76
-
77
-
78
-
79
-
80
-
81
 |
 |

43
page
Sony Corporation Annual Report 1999
Quarterly Financial and Stock Information
Sony Corporation and Consolidated Subsidiaries
(Unaudited)
Year ended March 31
Yen in billions except per share amounts
1st Quarter 2nd Quarter 3rd Quarter 4th Quarter
1998 1999 1998 1999 1998 1999 1998 1999
Sales and operating revenue . . . . ¥1,430.3 ¥1,617.3 ¥1,638.5 ¥1,751.1 ¥2,012.7 ¥1,948.0 ¥1,674.0 ¥1,478.3
Operating income (loss) . . . . . . . 97.3 92.5 140.4 110.0 223.7 179.4 58.9 (43.3)
Interest income (expense), net . . . (9.8) (6.2) (10.5) (8.1) (11.6) (7.4) (9.6) (3.3)
Foreign exchange gain
(loss), net . . . . . . . . . . . . . . . 6.4 (1.1) (6.8) 0.9 6.8 7.0 3.6 (3.9)
Income (loss) before
income taxes . . . . . . . . . . . . . . 91.9 92.1 110.2 101.3 214.3 232.0 37.4 (57.3)
Income taxes . . . . . . . . . . . . . . 54.6 47.6 48.6 53.5 96.9 112.4 14.8 (36.5)
Net income (loss) . . . . . . . . . . . 34.8 40.9 56.1 45.1 110.4 112.3 20.8 (19.4)
Net income (loss) per share
Basic . . . . . . . . . . . . . . . . . . ¥ 89.8 ¥ 100.1 ¥ 141.7 ¥ 110.0 ¥ 274.4 ¥ 274.0 ¥ 51.0 ¥ (47.2)
Diluted . . . . . . . . . . . . . . . . . 76.3 89.5 122.1 98.5 239.0 243.5 45.9 (47.2)
Depreciation and amortization* . . ¥ 65.6 ¥ 69.2 ¥ 72.9 ¥ 78.0 ¥ 78.3 ¥ 78.2 ¥ 84.8 ¥ 81.8
Capital expenditures
(additions to fixed assets) . . . . . . 79.0 76.0 88.8 86.2 83.3 82.5 136.9 109.0
R&D expenses . . . . . . . . . . . . . . 69.7 79.9 80.5 96.3 79.6 85.7 88.2 113.4
Tokyo Stock Exchange price
per share of Common Stock:
High . . . . . . . . . . . . . . . . . . ¥ 10,100 ¥ 12,040 ¥ 12,600 ¥ 13,490 ¥ 12,200 ¥ 9,420 ¥ 12,700 ¥ 11,930
Low . . . . . . . . . . . . . . . . . . . 8,520 10,430 9,550 8,760 9,320 7,230 10,400 7,290
New York Stock Exchange price
per American Depositary Share:
High . . . . . . . . . . . . . . . . . . $ 88 7/8$895/16 $103 11/16 $97 $987/16 $76
7/8$97
3/16 $ 100 3/4
Low . . . . . . . . . . . . . . . . . . . 69 1/277 1/285 1/16 66 15/16 74 1/260 1/482 5/16 65 1/2
* Including amortization of deferred insurance acquisition costs
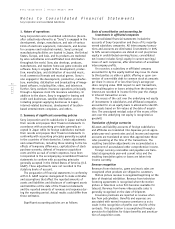
Notes: 1. Basic net income (loss) per share (EPS) is computed based on the average number of shares of common stock outstanding during each
period and diluted EPS assumes the dilution that could occur if securities or other contracts to issue common stock were exercised or
converted into common stock or resulted in the issuance of common stock.
2. Income before income taxes and net income figures for the third quarter of the fiscal year ended March 31, 1999 include gains of ¥58.7
billion ($489 million) and ¥30.7 billion ($256 million), respectively, which resulted from a contribution of securities to an outside trust
for employee retirement benefit purposes.