Sony 1999 Annual Report Download - page 46
Download and view the complete annual report
Please find page 46 of the 1999 Sony annual report below. You can navigate through the pages in the report by either clicking on the pages listed below, or by using the keyword search tool below to find specific information within the annual report.-
 1
1 -
2
-
3
-
4
-
5
-
6
-
7
-
8
-
9
-
10
-
11
-
12
-
13
-
14
-
15
-
16
-
17
-
18
-
19
-
20
-
21
-
22
-
23
-
24
-
25
-
26
-
27
-
28
-
29
-
30
-
31
-
32
-
33
-
34
-
35
-
 36
36 -
 37
37 -
 38
38 -
 39
39 -
 40
40 -
 41
41 -
 42
42 -
 43
43 -
 44
44 -
 45
45 -
 46
46 -
 47
47 -
 48
48 -
 49
49 -
 50
50 -
 51
51 -
 52
52 -
 53
53 -
 54
54 -
 55
55 -
 56
56 -
57
-
58
-
59
-
60
-
61
-
62
-
63
-
64
-
65
-
66
-
67
-
68
-
69
-
70
-
71
-
72
-
73
-
74
-
75
-
76
-
77
-
78
-
79
-
80
-
81
 |
 |

44
page
Sony Corporation Annual Report 1999
Five-Year Summary of Selected Financial Data
Sony Corporation and Consolidated Subsidiaries • Year ended March 31
Dollars in
Yen in millions thousands except
except per share amounts per share amounts
1995 1996 1997 1998 1999 1999
FOR THE YEAR
Sales and operating revenue . . . ¥3,990,583 ¥4,592,565 ¥5,663,134 ¥6,755,490 ¥6,794,619 $56,621,825
Operating income (loss) . . . . . (166,640) 235,324 370,330 520,210 338,649 2,822,075
Income (loss) before income
taxes . . . . . . . . . . . . . . . . . (220,948) 138,159 312,429 453,749 368,128 3,067,733
Income taxes . . . . . . . . . . . . 65,173 77,158 163,570 214,868 176,973 1,474,775
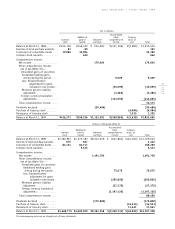
Net income (loss) . . . . . . . . . (293,356) 54,252 139,460 222,068 179,004 1,491,700
Per share data:
Net income (loss)
— Basic . . . . . . . . . . . . ¥ (784.7) ¥ 145.1 ¥
367.7 ¥ 557.7 ¥ 436.9 $ 3.64
— Diluted . . . . . . . . . . . (784.7) 134.0 309.2 483.4 391.0 3.26
Cash dividends. . . . . . . . . . 50.0 50.0 55.0 60.0 50.0 0.42
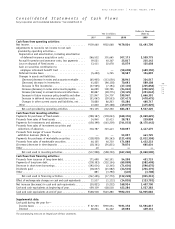
Depreciation and amortization
*. . ¥ 226,984** ¥ 227,316 ¥ 266,532 ¥ 301,665 ¥ 307,173 $ 2,559,775
Capital expenditures
(additions to fixed assets) . . . 250,678 251,197 298,078 387,955 353,730 2,947,750
R&D expenses . . . . . . . . . . . . 239,164 257,326 282,569 318,044 375,314 3,127,617
AT YEAR-END
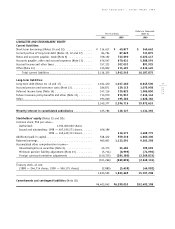
Net working capital . . . . . . . . ¥ 537,733 ¥ 816,361 ¥ 843,500 ¥1,151,152 ¥1,126,848 $ 9,390,400
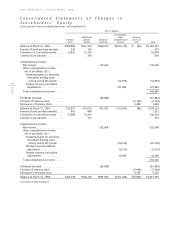
Stockholders’ equity . . . . . . . . 1,007,802 1,169,147 1,459,332 1,815,555 1,823,665 15,197,208
Stockholders’ equity
per share . . . . . . . . . . . . . . ¥ 2,695.31 ¥ 3,125.53 ¥ 3,798.62 ¥ 4,461.39 ¥ 4,448.69 $ 37.07
Total assets . . . . . . . . . . . . . ¥4,223,914 ¥5,045,699 ¥5,680,246 ¥6,403,043 ¥6,299,053 $52,492,108
Number of shares issued at
year-end (thousands of shares) 373,911 374,068 384,185 407,195 410,439
*Including amortization of deferred insurance acquisition costs
**Excluding write-off of goodwill
Notes: 1. U.S. dollar amounts have been translated from yen, for convenience only, at the rate of ¥120=U.S.$1, the approximate Tokyo foreign
exchange market rate as of March 31, 1999, as described in Note 3 of Notes to Consolidated Financial Statements.
2. Basic net income (loss) per share (EPS) is computed based on the average number of shares of common stock outstanding during each
period and diluted EPS assumes the dilution that could occur if securities or other contracts to issue common stock were exercised or
converted into common stock or resulted in the issuance of common stock.
3. Cash dividends per share for the year ended March 31, 1999 include a year-end dividend of ¥25 ($0.21), which is subject to approval of the
ordinary general meeting of stockholders to be held on June 29, 1999.
4. Income before income taxes and net income figures for the fiscal year ended March 31, 1999 include gains of ¥58.7 billion ($489 million)
and ¥30.7 billion ($256 million), respectively, which resulted from a contribution of securities to an outside trust for employee retirement
benefit purposes.
5. The consolidated results for the fiscal year ended March 31, 1995 reflect the write-off of goodwill of ¥265 billion in the Pictures segment
and losses in the Pictures segment of approximately ¥50 billion arising from a combination of unusual items, such as abandoning a large
number of projects in development and providing for settlement of outstanding lawsuits and contract claims.
250,678 251,197 298,078 387,955 353,730 2,947,750