Sony 1999 Annual Report Download - page 39
Download and view the complete annual report
Please find page 39 of the 1999 Sony annual report below. You can navigate through the pages in the report by either clicking on the pages listed below, or by using the keyword search tool below to find specific information within the annual report.-
 1
1 -
2
-
3
-
4
-
5
-
6
-
7
-
8
-
9
-
10
-
11
-
12
-
13
-
14
-
15
-
16
-
17
-
18
-
19
-
20
-
21
-
22
-
23
-
24
-
25
-
26
-
27
-
28
-
 29
29 -
 30
30 -
 31
31 -
 32
32 -
 33
33 -
 34
34 -
 35
35 -
 36
36 -
 37
37 -
 38
38 -
 39
39 -
 40
40 -
 41
41 -
 42
42 -
 43
43 -
 44
44 -
 45
45 -
 46
46 -
 47
47 -
 48
48 -
 49
49 -
50
-
51
-
52
-
53
-
54
-
55
-
56
-
57
-
58
-
59
-
60
-
61
-
62
-
63
-
64
-
65
-
66
-
67
-
68
-
69
-
70
-
71
-
72
-
73
-
74
-
75
-
76
-
77
-
78
-
79
-
80
-
81
 |
 |

Sony Corporation Annual Report 1999
37
page
Insurance
In the Insurance business, despite the sluggish insurance
market in Japan, revenue increased by 48.3 billion yen, or
16.6%, to 339.4 billion yen. Operating income, however,
decreased by 2.3 billion yen, or 11.2%, to 18.0 billion yen.
Operating margin decreased from 7.0% to 5.3%.
The revenue increase was due to significant net increases
in individual and group insurance-in-force of Sony Life Insur-
ance Co., Ltd. (“Sony Life”) in Japan resulting from strong
sales of traditional insurance products such as term-life insur-
ance and whole-life insurance as well as medical insurance.
The decrease in operating income was principally the
result of lower returns on fixed income investments in Japan,
where extremely low interest rates have prevailed, while
Sony Life conservatively managed its investment assets prin-
cipally through government and corporate bonds.
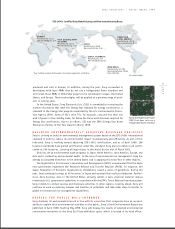
For future business development, Sony Insurance Plan-
ning Inc. was established in October 1998 in order to start
direct sales of individual automobile insurance in Japan.
Sony Insurance Planning Inc. is currently applying for a
license and setting up operational infrastructure to start its
business in the fall of 1999.
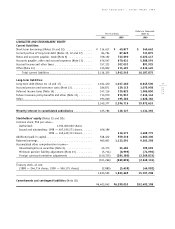
Condensed Insurance Business Balance Sheet
The Insurance business is included on a consolidated basis
in Sony’s consolidated financial statements. The following
schedule shows unaudited condensed balance sheets for the
Insurance business and for Sony with the Insurance busi-
ness’ financial position reflected on the equity basis.
(Although inter-business balances between Insurance busi-
ness and businesses other than Insurance business are not
eliminated in the respective balance sheets, such amounts
are not material.) While this presentation differs from that
provided under U.S. GAAP used in Sony’s consolidated
financial statements, because the Insurance business is
different in nature from Sony’s Electronics, Game, Music,
and Pictures businesses, management believes that this type
of comparative presentation helps the understanding and
analysis of Sony’s consolidated balance sheet.
Sony with Insurance
Insurance business business on the equity basis
Dollars in Dollars in
Yen in millions thousands Yen in millions thousands
March 31 March 31, March 31 March 31,
1998 1999 1999 1998 1999 1999
ASSETS
Cash and time deposits. . . . . . . . . ¥ 76,135 ¥ 114,695 $ 955,792 ¥ 454,290 ¥ 501,819 $ 4,181,825
Marketable securities . . . . . . . . . . 51,942 62,112 517,600 117,267 55,745 464,542
Other current assets . . . . . . . . . . . 9,400 10,000 83,333 2,558,561 2,326,837 19,390,308
Investments and advances . . . . . . 573,858 720,020 6,000,167 276,604 260,716 2,172,633
Investments in insurance business . — ——115,032 133,546 1,112,883
Deferred insurance
acquisition costs . . . . . . . . . . . 163,120 199,868 1,665,567 ———
Other long-term assets . . . . . . . . . 24,561 22,310 185,916 2,098,535 2,027,909 16,899,242
¥899,016 ¥ 1,129,005 $9,408,375 ¥5,620,289 ¥ 5,306,572 $44,221,433
LIABILITIES AND STOCKHOLDERS’ EQUITY
Future insurance policy benefits
and other . . . . . . . . . . . . . . . . ¥713,970 ¥ 913,937 $7,616,142 ¥—¥—$ —
Other liabilities and
minority interest . . . . . . . . . . . 69,766 81,226 676,883 3,804,734 3,482,907 29,024,225
Total liabilities and
minority interest . . . . . . . . . . . 783,736 995,163 8,293,025 3,804,734 3,482,907 29,024,225
Stockholders’ equity . . . . . . . . . . . 115,280 133,842 1,115,350 1,815,555 1,823,665 15,197,208
¥899,016 ¥ 1,129,005 $9,408,375 ¥5,620,289 ¥ 5,306,572 $44,221,433