Sony 1999 Annual Report Download - page 36
Download and view the complete annual report
Please find page 36 of the 1999 Sony annual report below. You can navigate through the pages in the report by either clicking on the pages listed below, or by using the keyword search tool below to find specific information within the annual report.-
 1
1 -
2
-
3
-
4
-
5
-
6
-
7
-
8
-
9
-
10
-
11
-
12
-
13
-
14
-
15
-
16
-
17
-
18
-
19
-
20
-
21
-
22
-
23
-
24
-
25
-
 26
26 -
 27
27 -
 28
28 -
 29
29 -
 30
30 -
 31
31 -
 32
32 -
 33
33 -
 34
34 -
 35
35 -
 36
36 -
 37
37 -
 38
38 -
 39
39 -
 40
40 -
 41
41 -
 42
42 -
 43
43 -
 44
44 -
 45
45 -
 46
46 -
47
-
48
-
49
-
50
-
51
-
52
-
53
-
54
-
55
-
56
-
57
-
58
-
59
-
60
-
61
-
62
-
63
-
64
-
65
-
66
-
67
-
68
-
69
-
70
-
71
-
72
-
73
-
74
-
75
-
76
-
77
-
78
-
79
-
80
-
81
 |
 |

Sony Corporation Annual Report 1999
34
page
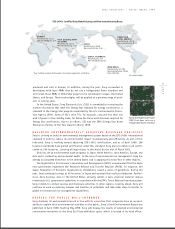
Aiming at reducing inventories and costs, Sony reorga-
nized facilities in North America (Mexico) and in Eastern
Europe (Slovakia and Hungary) and integrated certain
facilities in Asia (Malaysia and Indonesia) during the year.
Performance by Product Category
In the “Audio” category, sales decreased by 55.2 billion
yen, or 4.9% (down approximately 7% on a constant
currency basis), to 1,072.6 billion yen. Lower sales prin-
cipally reflected a steep decline in sales of home stereos
and radio-cassette tape recorders in Asia, Russia and
Eastern Europe, and Latin America. Sales of compact
cassette headphone stereos decreased worldwide, par-
ticularly in Asia. Also, intensified price competition in
the U.S. and Western Europe hurt sales. However, sales
of MD headphone stereos increased primarily in Japan
and Western Europe.
In the “Video” category, sales increased by 98.3
billion yen, or 11.3% (up approximately 8% on a con-
stant currency basis), to 969.1 billion yen. Home-use
camcorders, digital still cameras, and DVD-Video players
in the U.S. and in Western Europe were responsible for
much of this growth. Strong sales of home-use
camcorders particularly contributed to profitability.
During the year, digital models attained approximately
60% (compared to approximately 56% in the previous
year) of Sony’s unit sales of camcorders in Japan and
this ratio is also growing on a worldwide basis. In home-
use VHS video decks, sales were weak principally in the
U.S., Russia and Eastern Europe, and Latin America. In
broadcast- and professional-use video equipment, sales
increased only slightly, primarily due to the diversifica-
tion of competitors in line with digitization and inten-
sified price competition. Reflecting increased demands
of broadcasters for digital equipment, sales of digital
systems, including video servers equipped with hard
disk drives and news editing terminals, increased prin-
cipally in the U.S. and Western Europe. However, a
significant sales decline in analog video systems and an
increase in research and development expenses due to
the aforementioned digitization reduced profitability in
this product area.
In the “Televisions” category, sales decreased by 6.4
billion yen, or 0.9% (down approximately 3% on a con-
stant currency basis), to 702.6 billion yen. Sales of color
TVs declined substantially in Asia, Russia and Eastern
Europe, and Latin America. However, the Wega series of
color TVs, which incorporates flat surface CRTs, performed
extremely well in Japan and the U.S. partially due to an
expansion of its lineups during the year, and also con-
tributed to earnings. Sales of large-screen rear projec-
tion TVs also increased in the U.S. and Western Europe.
The Wega series reached approximately 45% (compared
to approximately 20% in the previous year) of Sony’s
unit sales of color TVs in Japan. This ratio is expected to
grow worldwide as Sony has established production
capabilities for high value-added flat surface CRTs in
Japan, the U.S., Western Europe, and Asia.
In the “Information and communications” category,
sales increased by 19.3 billion yen, or 2.2% (down
approximately 1% on a constant currency basis), to 914.1
billion yen. The slow growth was primarily attributable
to a decline in sales of computer displays and cellular
phones. In the computer display business, sales and
operating income substantially decreased, principally in
the U.S., due to severe industry-wide price competition
resulting from pricing pressures from manufacturers in
Asia, an oversupply of product, and weak demand. In
the cellular phones business, sales and operating income
decreased in Europe and Japan principally due to inten-
sified price competition and a delay in new product
introductions. Sales and operating income in the U.S.
were negatively impacted by the sales decline and an
increase in service expenses, resulting primarily from
quality issues of certain types of cellular phones includ-
ing the impact of correcting power emission levels. The
combined impact of the computer display and cellular
phone businesses adversely affected the overall results
of the Electronics business. In the PC business, sales in
the U.S. decreased because notebook PC OEM sales, which
recorded strong sales in the previous fiscal year, ceased
and because of intensified price competition in desktop
PCs. However, overall PC sales increased primarily due
to much higher sales of both notebook and desktop VAIO
PCs in Japan. In terms of earnings, the positive contri-
bution from notebook PCs in the second half of the year
was overshadowed by the overall negative impact of
desktop PCs. In computer peripherals, CD-RW drives,
which permit repeated recordings of massive data,
recorded strong sales growth in the U.S. and Western
Europe, while sales of CD-ROM drives declined.