Sony 1999 Annual Report Download - page 51
Download and view the complete annual report
Please find page 51 of the 1999 Sony annual report below. You can navigate through the pages in the report by either clicking on the pages listed below, or by using the keyword search tool below to find specific information within the annual report.-
 1
1 -
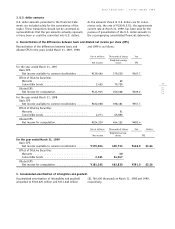
2
-
3
-
4
-
5
-
6
-
7
-
8
-
9
-
10
-
11
-
12
-
13
-
14
-
15
-
16
-
17
-
18
-
19
-
20
-
21
-
22
-
23
-
24
-
25
-
26
-
27
-
28
-
29
-
30
-
31
-
32
-
33
-
34
-
35
-
36
-
37
-
38
-
39
-
40
-
 41
41 -
 42
42 -
 43
43 -
 44
44 -
 45
45 -
 46
46 -
 47
47 -
 48
48 -
 49
49 -
 50
50 -
 51
51 -
 52
52 -
 53
53 -
 54
54 -
 55
55 -
 56
56 -
 57
57 -
 58
58 -
 59
59 -
 60
60 -
 61
61 -
62
-
63
-
64
-
65
-
66
-
67
-
68
-
69
-
70
-
71
-
72
-
73
-
74
-
75
-
76
-
77
-
78
-
79
-
80
-
81
 |
 |

49
page
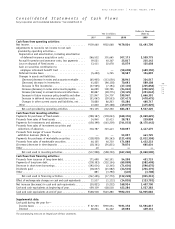
Sony Corporation Annual Report 1999
Dollars in thousands
Yen in millions (Note 3)
1997 1998 1999 1999
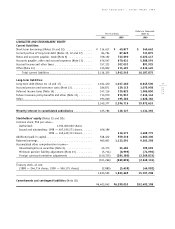
Cash flows from operating activities:
Net income. . . . . . . . . . . . . . . . . . . . . . . . . . . . . . . . . . . ¥139,460 ¥222,068 ¥179,004 $1,491,700
Adjustments to reconcile net income to net cash
provided by operating activities—
Depreciation and amortization, including amortization
of deferred insurance acquisition costs . . . . . . . . . . . . . 266,532 301,665 307,173 2,559,775
Accrual for pension and severance costs, less payments . . . . 19,521 40,367 25,817 215,142
Loss on disposal of fixed assets . . . . . . . . . . . . . . . . . . . 13,411 22,678 15,079 125,658
Gain on securities contribution to
employee retirement benefit trust . . . . . . . . . . . . . . . . — — (58,698) (489,150)
Deferred income taxes . . . . . . . . . . . . . . . . . . . . . . . . . (5,490) 4,755 18,587 154,892
Changes in assets and liabilities:
(Increase) decrease in notes and accounts receivable . . . . (65,905) (113,050) 38,942 324,517
(Increase) decrease in inventories . . . . . . . . . . . . . . . 41,825 (96,138) 70,693 589,108
Increase in film inventories . . . . . . . . . . . . . . . . . . . . (37,565) (7,194) (27,103) (225,858)
Increase (decrease) in notes and accounts payable . . . . . . 66,099 109,785 (24,063) (200,525)
Increase (decrease) in accrued income and other taxes . . . . 89,887 (28,775) (30,125) (251,042)
Increase in future insurance policy benefits and other . . . 131,947 134,707 199,967 1,666,391
Increase in deferred insurance acquisition costs . . . . . . (51,067) (39,553) (57,417) (478,475)
Changes in other current assets and liabilities, net . . . . 70,880 86,203 55,286 460,717
Other . . . . . . . . . . . . . . . . . . . . . . . . . . . . . . . . . . . . . 43,600 (25,168) (49,875) (415,625)
Net cash provided by operating activities . . . . . . . . . . 723,135 612,350 663,267 5,527,225
Cash flows from investing activities:
Payments for purchases of fixed assets . . . . . . . . . . . . . . . . (298,187) (378,053) (368,355) (3,069,625)
Proceeds from sales of fixed assets . . . . . . . . . . . . . . . . . . 14,940 22,413 28,783 239,858
Payments for investments and advances . . . . . . . . . . . . . . . (450,399) (463,239) (741,053) (6,175,442)
Proceeds from sales of investment securities and
collections of advances . . . . . . . . . . . . . . . . . . . . . . . . . 316,787 323,443 530,097 4,417,475
Proceeds from merger of Loews Theatres
exhibition business (Note 6) . . . . . . . . . . . . . . . . . . . . . . — — 53,007 441,725
Payments for purchases of marketable securities . . . . . . . . . (128,929) (95,163) (121,483) (1,012,358)
Proceeds from sales of marketable securities . . . . . . . . . . . . 46,105 46,730 171,868 1,432,233
(Increase) decrease in time deposits . . . . . . . . . . . . . . . . . (18,361) (54,831) 79,876 665,634
Other . . . . . . . . . . . . . . . . . . . . . . . . . . . . . . . . . . . . . . . 46 — ——
Net cash used in investing activities . . . . . . . . . . . . . . (517,998) (598,700) (367,260) (3,060,500)
Cash flows from financing activities:
Proceeds from issuance of long-term debt. . . . . . . . . . . . . . 171,698 342,101 54,208 451,733
Payments of long-term debt . . . . . . . . . . . . . . . . . . . . . . . (209,383) (332,154) (69,889) (582,408)
Decrease in short-term borrowings . . . . . . . . . . . . . . . . . . . (192,034) (2,345) (71,601) (596,675)
Dividends paid . . . . . . . . . . . . . . . . . . . . . . . . . . . . . . . . (18,657) (21,582) (24,501) (204,175)
Other . . . . . . . . . . . . . . . . . . . . . . . . . . . . . . . . . . . . . . . 881 (3,790) (445) (3,708)
Net cash used in financing activities . . . . . . . . . . . . . . (247,495) (17,770) (112,228) (935,233)
Effect of exchange rate changes on cash and cash equivalents . . 11,537 (1,112) (14,855) (123,792)
Net increase (decrease) in cash and cash equivalents . . . . . . (30,821) (5,232) 168,924 1,407,700
Cash and cash equivalents at beginning of year . . . . . . . . . . 459,339 428,518 423,286 3,527,383
Cash and cash equivalents at end of year . . . . . . . . . . . . . . ¥428,518 ¥423,286 ¥592,210 $4,935,083
Supplemental data:
Cash paid during the year for—
Income taxes . . . . . . . . . . . . . . . . . . . . . . . . . . . . . . . ¥ 87,723 ¥239,054 ¥191,378 $1,594,817
Interest . . . . . . . . . . . . . . . . . . . . . . . . . . . . . . . . . . . 68,004 64,102 49,096 409,133
The accompanying notes are an integral part of these statements.
Consolidated Statements of Cash Flows
Sony Corporation and Consolidated Subsidiaries •Year ended March 31