Sony 1999 Annual Report Download - page 47
Download and view the complete annual report
Please find page 47 of the 1999 Sony annual report below. You can navigate through the pages in the report by either clicking on the pages listed below, or by using the keyword search tool below to find specific information within the annual report.-
 1
1 -
2
-
3
-
4
-
5
-
6
-
7
-
8
-
9
-
10
-
11
-
12
-
13
-
14
-
15
-
16
-
17
-
18
-
19
-
20
-
21
-
22
-
23
-
24
-
25
-
26
-
27
-
28
-
29
-
30
-
31
-
32
-
33
-
34
-
35
-
36
-
 37
37 -
 38
38 -
 39
39 -
 40
40 -
 41
41 -
 42
42 -
 43
43 -
 44
44 -
 45
45 -
 46
46 -
 47
47 -
 48
48 -
 49
49 -
 50
50 -
 51
51 -
 52
52 -
 53
53 -
 54
54 -
 55
55 -
 56
56 -
 57
57 -
58
-
59
-
60
-
61
-
62
-
63
-
64
-
65
-
66
-
67
-
68
-
69
-
70
-
71
-
72
-
73
-
74
-
75
-
76
-
77
-
78
-
79
-
80
-
81
 |
 |

45
page
Sony Corporation Annual Report 1999
Dollars in
Yen in millions thousands**
1995 1996 1997 1998 1999 1999
BY BUSINESS SEGMENT*
Electronics . . . . . . . . . . . . . . . . . . ¥3,027,434 ¥3,283,234 ¥3,930,292 ¥4,377,346 ¥4,355,001 $36,291,675
75.9% 71.5% 69.4% 64.8% 64.1%
Game . . . . . . . . . . . . . . . . . . . . . . 35,449 200,894 408,335 699,574 760,071 6,333,925
0.9 4.4 7.2 10.4 11.2
Music . . . . . . . . . . . . . . . . . . . . . . 481,021 506,455 570,119 660,407 718,878 5,990,650
12.0 11.0 10.1 9.8 10.6
Pictures . . . . . . . . . . . . . . . . . . . . 281,677 317,382 438,551 642,714 540,109 4,500,908
7.1 6.9 7.7 9.5 7.9
Insurance . . . . . . . . . . . . . . . . . . . 112,831 206,802 227,920 291,061 339,368 2,828,067
2.8 4.5 4.0 4.3 5.0
Other . . . . . . . . . . . . . . . . . . . . . . 52,171 77,798 87,917 84,388 81,192 676,600
1.3 1.7 1.6 1.2 1.2
Consolidated total . . . . . . . . . . . . . ¥3,990,583 ¥4,592,565 ¥5,663,134 ¥6,755,490 ¥6,794,619 $56,621,825
* Sales and operating revenue to customers
Note: As a result of a change in the accounting period in Pictures, results for the year ended March 31, 1998 in the segment include the thirteen-
month period from March 1, 1997 to March 31, 1998.
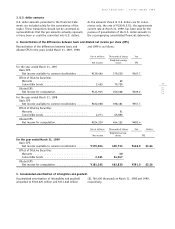
« Electronics Sales and Operating Revenue to Customers by Product Category »
Audio . . . . . . . . . . . . . . . . . . . . ¥ 900,180 ¥ 900,400 ¥1,029,961 ¥1,127,788 ¥1,072,621 $ 8,938,508
29.7% 27.4% 26.2% 25.8% 24.6%
Video . . . . . . . . . . . . . . . . . . . . 685,802 731,097 816,582 870,854 969,129 8,076,075
22.6 22.3 20.8 19.9 22.3
Televisions . . . . . . . . . . . . . . . . 544,255 554,023 704,075 709,043 702,620 5,855,167
18.0 16.9 17.9 16.2 16.1
Information and communications . . 413,445 540,719 764,512 894,810 914,140 7,617,833
13.7 16.5 19.4 20.4 21.0
Electronic components and other . . 483,752 556,995 615,162 774,851 696,491 5,804,092
16.0 16.9 15.7 17.7 16.0
Total . . . . . . . . . . . . . . . . . . . . ¥3,027,434 ¥3,283,234 ¥3,930,292 ¥4,377,346 ¥4,355,001 $36,291,675
Note: The above table is a breakdown of Electronics sales and operating revenue to customers by product category. The Electronics business is
managed as a single operating segment by Sony’s management. However, Sony believes that the information in this table is useful to
investors in understanding the sales contributions of the products in this business segment. Operating income information by product
category is not available.
BY GEOGRAPHIC SEGMENT
Japan . . . . . . . . . . . . . . . . . . . . . ¥1,105,152 ¥1,379,804 ¥1,590,820 ¥1,843,149 ¥1,908,600 $15,905,000
27.7% 30.0% 28.1% 27.3% 28.1%
United States . . . . . . . . . . . . . . . . 1,152,081 1,259,926 1,639,334 2,101,907 2,157,061 17,975,509
28.9 27.4 29.0 31.1 31.8
Europe . . . . . . . . . . . . . . . . . . . . . 905,416 1,054,010 1,304,491 1,567,121 1,666,714 13,889,283
22.7 23.0 23.0 23.2 24.5
Other Areas . . . . . . . . . . . . . . . . . 827,934 898,825 1,128,489 1,243,313 1,062,244 8,852,033
20.7 19.6 19.9 18.4 15.6
Consolidated total . . . . . . . . . . . . . ¥3,990,583 ¥4,592,565 ¥5,663,134 ¥6,755,490 ¥6,794,619 $56,621,825
Note: Classification of Geographic Segment Information shows sales and operating revenue recognized by location of customers.
** U.S. dollar amounts have been translated from yen, for convenience only, at the rate of ¥120=U.S.$1, the approximate Tokyo foreign exchange
market rate as of March 31, 1999, as described in Note 3 of Notes to Consolidated Financial Statements.
Composition of Sales and Operating Revenue
by Business and Geographic Segment
Sony Corporation and Consolidated Subsidiaries
Year ended March 31