Sony 1999 Annual Report Download - page 65
Download and view the complete annual report
Please find page 65 of the 1999 Sony annual report below. You can navigate through the pages in the report by either clicking on the pages listed below, or by using the keyword search tool below to find specific information within the annual report.-
 1
1 -
2
-
3
-
4
-
5
-
6
-
7
-
8
-
9
-
10
-
11
-
12
-
13
-
14
-
15
-
16
-
17
-
18
-
19
-
20
-
21
-
22
-
23
-
24
-
25
-
26
-
27
-
28
-
29
-
30
-
31
-
32
-
33
-
34
-
35
-
36
-
37
-
38
-
39
-
40
-
41
-
42
-
43
-
44
-
45
-
46
-
47
-
48
-
49
-
50
-
51
-
52
-
53
-
54
-
 55
55 -
 56
56 -
 57
57 -
 58
58 -
 59
59 -
 60
60 -
 61
61 -
 62
62 -
 63
63 -
 64
64 -
 65
65 -
 66
66 -
 67
67 -
 68
68 -
 69
69 -
 70
70 -
 71
71 -
 72
72 -
 73
73 -
 74
74 -
 75
75 -
76
-
77
-
78
-
79
-
80
-
81
 |
 |

63
page
Sony Corporation Annual Report 1999
Japanese plans Foreign plans
Dollars in Dollars in
Yen in millions thousands Yen in millions thousands
March 31 March 31, March 31 March 31,
1998 1999 1999 1998 1999 1999
Change in benefit obligation:
Benefit obligation at beginning
of year . . . . . . . . . . . . . . . . . . ¥393,448 ¥476,068 $3,967,233 ¥74,673 ¥85,159 $709,658
Service cost . . . . . . . . . . . . . . . 35,318 41,743 347,859 15,625 15,842 132,017
Interest cost . . . . . . . . . . . . . . . 13,303 14,020 116,833 4,911 5,333 44,442
Plan participants’ contributions . . 4,118 4,273 35,608 144 176 1,467
Amendments . . . . . . . . . . . . . . . — ——(1,971) (1,079) (8,992)
Actuarial loss . . . . . . . . . . . . . . 47,679 45,933 382,775 2,636 8,060 67,166
Foreign currency exchange rate
changes . . . . . . . . . . . . . . . . . — ——4,859 (9,322) (77,683)
Benefits paid . . . . . . . . . . . . . . (17,798) (19,176) (159,800) (15,718) (11,199) (93,325)
Benefit obligation at end of year . . 476,068 562,861 4,690,508 85,159 92,970 774,750
Change in plan assets:
Fair value of plan assets
at beginning of year . . . . . . . . . 204,491 236,966 1,974,717 43,837 54,597 454,975
Actual return on plan assets . . . . 7,843 27,845 232,042 7,016 7,005 58,375
Foreign currency exchange rate
changes . . . . . . . . . . . . . . . . . — ——3,164 (6,223) (51,859)
Employer contribution . . . . . . . . 25,667 106,738 889,483 3,993 8,274 68,950
Plan participants’ contributions . . 4,118 4,273 35,608 144 176 1,467
Benefits paid . . . . . . . . . . . . . . (5,153) (6,501) (54,175) (3,557) (3,532) (29,433)
Fair value of plan assets at
end of year . . . . . . . . . . . . . . . 236,966 369,321 3,077,675 54,597 60,297 502,475
Funded status . . . . . . . . . . . . . . . . 239,102 193,540 1,612,833 30,562 32,673 272,275
Unrecognized actuarial loss . . . . . . (91,343) (102,739) (856,159) (4,617) (8,983) (74,858)
Unrecognized net transition asset . . 2,729 2,354 19,617 492 263 2,191
Unrecognized prior service cost . . . . (12,496) (12,805) (106,708) 2,651 2,847 23,725
Net amount recognized . . . . . . . . . ¥137,992 ¥ 80,350 $ 669,583 ¥29,088 ¥26,800 $223,333
Amounts recognized in the
consolidated balance sheet consist of:
Accrued pension and
severance costs . . . . . . . . . . . . ¥158,684 ¥106,343 $ 886,192 ¥29,088 ¥26,800 $223,333
Intangibles . . . . . . . . . . . . . . . . (9,767) (10,451) (87,092) ———
Accumulated other comprehensive
income . . . . . . . . . . . . . . . . . . (10,925) (15,542) (129,517) ———
Net amount recognized . . . . . . . . . ¥137,992 ¥ 80,350 $ 669,583 ¥29,088 ¥26,800 $223,333
Assumptions as of March 31:
Discount rate . . . . . . . . . . . . . . 3.0% 2.7% 6.5-8.0% 4.4-7.3%
Expected return on plan assets . . . 4.0% 4.0% 6.5-9.8% 6.9-9.8%
Rate of compensation increase . . . 3.0% 3.0% 2.5-8.5% 2.8-8.5%
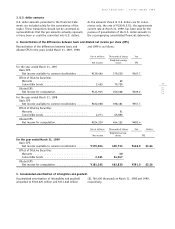
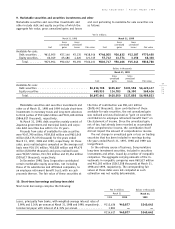
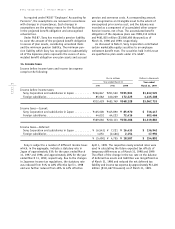
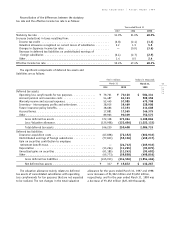
The changes in benefit obligation and plan assets,
funded status, composition of amounts recognized in the consolidated balance sheet and assumptions
used were as follows: