Sprint - Nextel 2005 Annual Report Download - page 110
Download and view the complete annual report
Please find page 110 of the 2005 Sprint - Nextel annual report below. You can navigate through the pages in the report by either clicking on the pages listed below, or by using the keyword search tool below to find specific information within the annual report.-
 1
1 -
2
-
3
-
4
-
5
-
6
-
7
-
8
-
9
-
10
-
11
-
12
-
13
-
14
-
15
-
16
-
17
-
18
-
19
-
20
-
21
-
22
-
23
-
24
-
25
-
26
-
27
-
28
-
29
-
30
-
31
-
32
-
33
-
34
-
35
-
36
-
37
-
38
-
39
-
40
-
41
-
42
-
43
-
44
-
45
-
46
-
47
-
48
-
49
-
50
-
51
-
52
-
53
-
54
-
55
-
56
-
57
-
58
-
59
-
60
-
61
-
62
-
63
-
64
-
65
-
66
-
67
-
68
-
69
-
70
-
71
-
72
-
73
-
74
-
75
-
76
-
77
-
78
-
79
-
80
-
81
-
82
-
83
-
84
-
85
-
86
-
87
-
88
-
89
-
90
-
91
-
92
-
93
-
94
-
95
-
96
-
97
-
98
-
99
-
 100
100 -
 101
101 -
 102
102 -
 103
103 -
 104
104 -
 105
105 -
 106
106 -
 107
107 -
 108
108 -
 109
109 -
 110
110 -
 111
111 -
 112
112 -
 113
113 -
 114
114 -
 115
115 -
 116
116 -
 117
117 -
 118
118 -
 119
119 -
 120
120 -
121
-
122
-
123
-
124
-
125
-
126
-
127
-
128
-
129
-
130
-
131
-
132
-
133
-
134
-
135
-
136
-
137
-
138
-
139
-
140
-
141
-
142
-
143
-
144
-
145
-
146
-
147
-
148
-
149
-
150
-
151
-
152
-
153
-
154
-
155
-
156
-
157
-
158
-
159
-
160
-
161
 |
 |

SPRINT NEXTEL CORPORATION
NOTES TO THE CONSOLIDATED FINANCIAL STATEMENTS — (Continued)
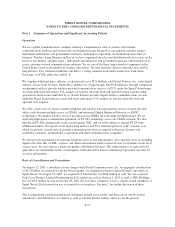
Cash and Cash Equivalents
Cash equivalents generally include highly liquid investments with original maturities of three months or less.
These investments include money market funds, U.S. government and government-sponsored debt securities,
corporate debt securities, municipal securities, repurchase agreements, and bank-related securities. All securities
meet our investment policy guidelines and are stated at cost, which approximates market value. As of
December 31, 2005, we have $93 million of restricted cash, which is included in prepaid expenses and other
current assets on the consolidated balance sheets. See note 9 for more information.
Our prior year amounts for auction rate securities have been reclassified from cash and cash equivalents to
marketable securities.
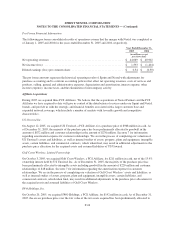
Supplemental Cash Flow Information
Year Ended December 31,
2005 2004 2003
(in millions)
Interest paid, net of capitalized interest ............................... $ 1,291 $ 1,279 $ 1,424
Interest received ................................................. 231 61 51
Income taxes paid ................................................ 138 (39) 83
Our non-cash activities included the following:
Year Ended December 31,
2005 2004 2003
(in millions)
Common stock issued:
Acquisition of Nextel ........................................... $ 35,645 $ — $ —
Vested stock option awards exchanged in acquisition of Nextel .......... 639 — —
Employee benefit stock plans ..................................... 90 53 51
Settlement of shareholder suit .................................... — 5 —
Earthlink common stock used to extinguish debt ....................... 90 48 —
Investments in Debt Securities
We classify our investments in marketable debt securities as available-for-sale and, therefore, report them at fair
value, based on quoted market prices. Interest on investments in debt securities is reinvested and recorded in
interest income in the accompanying consolidated statements of operations. We record unrealized holding gains
and losses as other comprehensive income (loss), net of related income taxes.
Investments in Equity Securities
We classify our investments in marketable equity securities as available-for-sale and, therefore, report them at
fair value, based on available market information. We record unrealized holding gains and losses as other
comprehensive income (loss), net of related income taxes. Realized gains or losses are recorded in earnings and
calculated using average cost. We assess declines in the value of individual investments to determine whether the
decline is other-than-temporary and thus the investment is impaired. We make this assessment by considering
available evidence, including changes in general market conditions, specific industry and individual company
data, the length of time and the extent to which the market value has been less than cost, the financial condition
and near-term prospects of the individual company and our intent and ability to hold the investment. We record
F-15