Sprint - Nextel 2005 Annual Report Download - page 71
Download and view the complete annual report
Please find page 71 of the 2005 Sprint - Nextel annual report below. You can navigate through the pages in the report by either clicking on the pages listed below, or by using the keyword search tool below to find specific information within the annual report.-
 1
1 -
2
-
3
-
4
-
5
-
6
-
7
-
8
-
9
-
10
-
11
-
12
-
13
-
14
-
15
-
16
-
17
-
18
-
19
-
20
-
21
-
22
-
23
-
24
-
25
-
26
-
27
-
28
-
29
-
30
-
31
-
32
-
33
-
34
-
35
-
36
-
37
-
38
-
39
-
40
-
41
-
42
-
43
-
44
-
45
-
46
-
47
-
48
-
49
-
50
-
51
-
52
-
53
-
54
-
55
-
56
-
57
-
58
-
59
-
60
-
 61
61 -
 62
62 -
 63
63 -
 64
64 -
 65
65 -
 66
66 -
 67
67 -
 68
68 -
 69
69 -
 70
70 -
 71
71 -
 72
72 -
 73
73 -
 74
74 -
 75
75 -
 76
76 -
 77
77 -
 78
78 -
 79
79 -
 80
80 -
 81
81 -
82
-
83
-
84
-
85
-
86
-
87
-
88
-
89
-
90
-
91
-
92
-
93
-
94
-
95
-
96
-
97
-
98
-
99
-
100
-
101
-
102
-
103
-
104
-
105
-
106
-
107
-
108
-
109
-
110
-
111
-
112
-
113
-
114
-
115
-
116
-
117
-
118
-
119
-
120
-
121
-
122
-
123
-
124
-
125
-
126
-
127
-
128
-
129
-
130
-
131
-
132
-
133
-
134
-
135
-
136
-
137
-
138
-
139
-
140
-
141
-
142
-
143
-
144
-
145
-
146
-
147
-
148
-
149
-
150
-
151
-
152
-
153
-
154
-
155
-
156
-
157
-
158
-
159
-
160
-
161
 |
 |

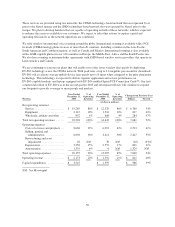
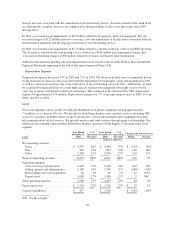
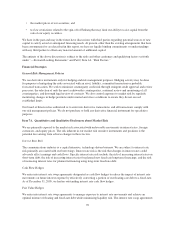
Local
Year Ended
December 31,
2004
%of
Operating
Revenues
Year Ended
December 31,
2003
%of
Operating
Revenues
Change from Previous Year
Dollars Percent
(dollars in millions)
Net operating revenues
Voice .......................... $ 4,498 70% $ 4,654 72% $ (156) (3)%
Data ........................... 833 13% 730 11% 103 14%
Other .......................... 1,090 17% 1,102 17% (12) (1)%
Total net operating revenues .......... 6,421 100% 6,486 100% (65) (1)%
Operating expenses
Costs of services and products ....... 2,198 34% 2,227 34% (29) (1)%
Selling, general and administrative . . . 1,358 21% 1,325 20% 33 2%
Restructuring and asset impairment . . 40 1% 25 1% 15 60%
Depreciation ..................... 1,089 17% 1,089 17% — 0%
Total operating expenses ............. 4,685 73% 4,666 72% 19 NM
Operating income .................. $ 1,736 27% $ 1,820 28% $ (84) (5)%
Capital expenditures ................ $ 1,018 $ 1,201 $ (183) (15)%
NM: Not Meaningful
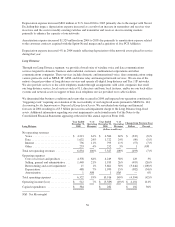
Net Operating Revenues
Net operating revenues increased 2% in 2005 compared to a decrease of 1% in 2004. The 2005 increase was
driven by growth in North Supply product sales and data revenue partially offset by lower voice revenue. In
2004, the increase in data revenue and North Supply product sales was more than offset by declines in voice
revenue and other telecom equipment sales. We ended 2005 with 7.4 million switched access lines, a decrease of
4% from the prior year. Access lines decreased 3% in 2004. The decreases in 2005 and 2004 were driven
principally by losses to wireless and cable providers, along with broadband substitution.
Voice Revenues
Voice revenues, consisting of revenue from local exchange services, long distance revenue and switched access
revenue, decreased 4% in 2005 and 3% in 2004 due to the decreases in access lines and access minutes of use.
The declines in both years were also impacted by the ending of FCC-allowable cost recoveries associated with
local number portability and recoveries for the cost of pooling telephone numbers in 2004.
Data Revenues
Data revenues are mainly derived from DSL, local data transport services, and special access. Data revenues
increased 18% in 2005 and 14% in 2004 mainly as a result of strong growth in DSL lines and special access sales
primarily to wireless companies. We ended 2005 with 693,000 DSL lines in service, an increase of 41%
compared to 2004.
Other Revenues
Other revenues increased 11% in 2005 after decreasing 1% in 2004. The 2005 increase was principally driven by
higher product sales due to a significant contract entered into by North Supply. The 2004 decrease was driven by
a decline in telecom equipment sales resulting from both a planned shift in focus to selling higher margin
products and a reduction in customer demand for equipment somewhat offset by an increase in North Supply
product sales.
60