Sprint - Nextel 2005 Annual Report Download - page 68
Download and view the complete annual report
Please find page 68 of the 2005 Sprint - Nextel annual report below. You can navigate through the pages in the report by either clicking on the pages listed below, or by using the keyword search tool below to find specific information within the annual report.-
 1
1 -
2
-
3
-
4
-
5
-
6
-
7
-
8
-
9
-
10
-
11
-
12
-
13
-
14
-
15
-
16
-
17
-
18
-
19
-
20
-
21
-
22
-
23
-
24
-
25
-
26
-
27
-
28
-
29
-
30
-
31
-
32
-
33
-
34
-
35
-
36
-
37
-
38
-
39
-
40
-
41
-
42
-
43
-
44
-
45
-
46
-
47
-
48
-
49
-
50
-
51
-
52
-
53
-
54
-
55
-
56
-
57
-
 58
58 -
 59
59 -
 60
60 -
 61
61 -
 62
62 -
 63
63 -
 64
64 -
 65
65 -
 66
66 -
 67
67 -
 68
68 -
 69
69 -
 70
70 -
 71
71 -
 72
72 -
 73
73 -
 74
74 -
 75
75 -
 76
76 -
 77
77 -
 78
78 -
79
-
80
-
81
-
82
-
83
-
84
-
85
-
86
-
87
-
88
-
89
-
90
-
91
-
92
-
93
-
94
-
95
-
96
-
97
-
98
-
99
-
100
-
101
-
102
-
103
-
104
-
105
-
106
-
107
-
108
-
109
-
110
-
111
-
112
-
113
-
114
-
115
-
116
-
117
-
118
-
119
-
120
-
121
-
122
-
123
-
124
-
125
-
126
-
127
-
128
-
129
-
130
-
131
-
132
-
133
-
134
-
135
-
136
-
137
-
138
-
139
-
140
-
141
-
142
-
143
-
144
-
145
-
146
-
147
-
148
-
149
-
150
-
151
-
152
-
153
-
154
-
155
-
156
-
157
-
158
-
159
-
160
-
161
 |
 |

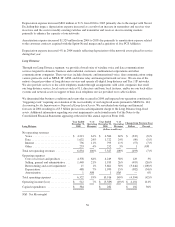
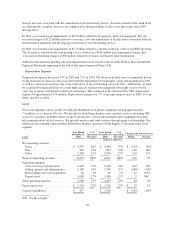
Long Distance
Year Ended
December 31,
2004
%of
Operating
Revenues
Year Ended
December 31,
2003
%of
Operating
Revenues
Change from Previous Year
Dollars Percent
(dollars in millions)
Net operating revenues
Voice .......................... $ 4,560 62% $ 4,999 63% $ (439) (9)%
Data ........................... 1,722 24% 1,853 23% (131) (7)%
Internet ......................... 793 11% 973 12% (180) (18)%
Other .......................... 252 3% 180 2% 72 40%
Total net operating revenues .......... 7,327 100% 8,005 100% (678) (8)%
Operating expenses
Costs of services and products ....... 4,249 58% 4,180 52% 69 2%
Selling, general and administrative . . . 1,935 26% 2,271 28% (336) (15)%
Restructuring and asset impairment . . 3,661 50% 1,564 20% 2,097 134%
Depreciation ..................... 1,070 15% 1,431 18% (361) (25)%
Amortization .................... 1 NM 1NM ——
Total operating expenses ............. 10,916 149% 9,447 118% 1,469 16%
Operating loss ..................... $ (3,589) (49)% $ (1,442) (18)% $ (2,147) 149%
Capital expenditures ................ $ 282 $ 339 $ (57) (17)%
NM: Not Meaningful
Net Operating Revenues
Net operating revenues decreased 7% in 2005 and 8% in 2004. Lower pricing associated with voice services, the
decline in the unbundled network element platform as we exited that market, and migration from legacy data
products played a large role in the declines for both years. Additionally, the termination of a large Dial IP
contract during 2004 and the sale of our wholesale Dial IP business in 2004 further contributed to the decreasing
revenues. Partially offsetting these declines in revenue were incremental revenues from selling services to the
cable companies.
In October 2004, we completed the sale of our wholesale Dial IP business for $34 million. These assets were
classified as held for sale on September 30, 2004, and an associated pre-tax non-cash charge of $21 million was
included in the 2004 impairment charge.
In 2006, we expect to see continued revenue declines in Long Distance due to lower pricing on commercial
contracts and continued pressures in the consumer long distance market. Increased competition and the
significant increase in capacity resulting from new technologies and networks may drive already low prices down
further. See “—Forward Looking Statements.”
Voice Revenues
Voice revenues decreased 8% in 2005 and 9% in 2004. Intense competition from the cable industry and the major
local exchange carriers for consumer and small business customers, as well as wireless, e-mail and instant
messaging substitution continue to erode the retail base and drive lower prices per minute, despite an 11%
increase in call volume in 2005 and a 13% increase in 2004. These declines were partially offset by an increase in
lower-yielding affiliate and wholesale revenue primarily from our relationships with certain cable providers.
Voice revenues generated from the provision of services to Wireless and Local represented 15% of total voice
revenues in 2005 compared to 13% in 2004.
Data Revenues
Data revenues reflect sales of current-generation data services, including ATM, managed network services,
private line, and frame relay services. Data revenues decreased 5% in 2005 and 7% in 2004. In 2005, frame relay
57