Sprint - Nextel 2005 Annual Report Download - page 72
Download and view the complete annual report
Please find page 72 of the 2005 Sprint - Nextel annual report below. You can navigate through the pages in the report by either clicking on the pages listed below, or by using the keyword search tool below to find specific information within the annual report.-
 1
1 -
2
-
3
-
4
-
5
-
6
-
7
-
8
-
9
-
10
-
11
-
12
-
13
-
14
-
15
-
16
-
17
-
18
-
19
-
20
-
21
-
22
-
23
-
24
-
25
-
26
-
27
-
28
-
29
-
30
-
31
-
32
-
33
-
34
-
35
-
36
-
37
-
38
-
39
-
40
-
41
-
42
-
43
-
44
-
45
-
46
-
47
-
48
-
49
-
50
-
51
-
52
-
53
-
54
-
55
-
56
-
57
-
58
-
59
-
60
-
61
-
 62
62 -
 63
63 -
 64
64 -
 65
65 -
 66
66 -
 67
67 -
 68
68 -
 69
69 -
 70
70 -
 71
71 -
 72
72 -
 73
73 -
 74
74 -
 75
75 -
 76
76 -
 77
77 -
 78
78 -
 79
79 -
 80
80 -
 81
81 -
 82
82 -
83
-
84
-
85
-
86
-
87
-
88
-
89
-
90
-
91
-
92
-
93
-
94
-
95
-
96
-
97
-
98
-
99
-
100
-
101
-
102
-
103
-
104
-
105
-
106
-
107
-
108
-
109
-
110
-
111
-
112
-
113
-
114
-
115
-
116
-
117
-
118
-
119
-
120
-
121
-
122
-
123
-
124
-
125
-
126
-
127
-
128
-
129
-
130
-
131
-
132
-
133
-
134
-
135
-
136
-
137
-
138
-
139
-
140
-
141
-
142
-
143
-
144
-
145
-
146
-
147
-
148
-
149
-
150
-
151
-
152
-
153
-
154
-
155
-
156
-
157
-
158
-
159
-
160
-
161
 |
 |
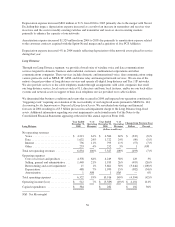
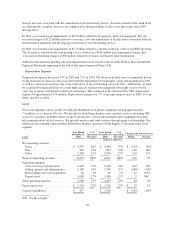
Costs of Services and Products
Costs of services and products include costs to operate and maintain the local network and costs of equipment
sales. These costs increased 10% in 2005 and decreased 1% in 2004. The 2005 increase was primarily driven by
the increase in North Supply product sales, higher costs associated with our increase in DSL, somewhat offset by
a decline in hurricane-related expenses. In 2004, general expense controls and lower costs associated with
telecom equipment sales were partially offset by an increase in North Supply product costs, higher pension costs
and approximately $30 million of hurricane-related expenses. Costs of services and products were 37% of net
operating revenues in 2005 and 34% in both 2004 and 2003.
Selling, General and Administrative Expense
Selling, general and administrative expense decreased 12% in 2005 and increased 2% in 2004. The 2005
decrease was primarily driven by reduced business selling and information technology costs. The 2004 increase
was primarily driven by higher pension costs and stock-based compensation, somewhat offset by general cost
controls.
Selling, general and administrative expense includes charges for estimated bad debt expense. The reserve for bad
debt requires management’s judgment and is based on historical trending, industry norms and recognition of
current market indicators about general economic conditions. Bad debt expense as a percentage of net revenues
was 1% in 2005, 2004, and 2003. The reserve for bad debt expense as a percentage of outstanding accounts
receivable was 8% in 2005 and 9% in both 2004 and 2003.
Selling, general and administrative expense was 18% of net operating revenues in 2005, and 21% in 2004 and
20% in 2003.
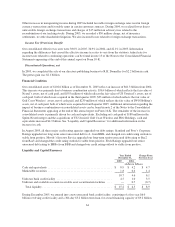
Restructuring and Asset Impairment
In 2005, we recorded restructuring and asset impairment charges of $82 million, of which $77 million related to
the write-off of certain internal-use software systems that are no longer being utilized.
In 2004, we recorded a $40 million restructuring charge related to severance costs associated with our
organizational realignment.
In 2003, we recorded restructuring charges of $25 million related to severance costs associated with our
organizational realignment, offset by the finalization of all 2001 and 2002 restructuring liabilities.
Additional information regarding our restructuring and asset impairments can be found in note 8 of the Notes to
the Consolidated Financial Statements appearing at the end of this annual report on Form 10-K.
Depreciation Expense
Depreciation expense was flat in 2005 as well as in 2004. Depreciation expense was 17% of net operating
revenues in 2005, 2004, and 2003.
61