Sprint - Nextel 2005 Annual Report Download - page 70
Download and view the complete annual report
Please find page 70 of the 2005 Sprint - Nextel annual report below. You can navigate through the pages in the report by either clicking on the pages listed below, or by using the keyword search tool below to find specific information within the annual report.-
 1
1 -
2
-
3
-
4
-
5
-
6
-
7
-
8
-
9
-
10
-
11
-
12
-
13
-
14
-
15
-
16
-
17
-
18
-
19
-
20
-
21
-
22
-
23
-
24
-
25
-
26
-
27
-
28
-
29
-
30
-
31
-
32
-
33
-
34
-
35
-
36
-
37
-
38
-
39
-
40
-
41
-
42
-
43
-
44
-
45
-
46
-
47
-
48
-
49
-
50
-
51
-
52
-
53
-
54
-
55
-
56
-
57
-
58
-
59
-
 60
60 -
 61
61 -
 62
62 -
 63
63 -
 64
64 -
 65
65 -
 66
66 -
 67
67 -
 68
68 -
 69
69 -
 70
70 -
 71
71 -
 72
72 -
 73
73 -
 74
74 -
 75
75 -
 76
76 -
 77
77 -
 78
78 -
 79
79 -
 80
80 -
81
-
82
-
83
-
84
-
85
-
86
-
87
-
88
-
89
-
90
-
91
-
92
-
93
-
94
-
95
-
96
-
97
-
98
-
99
-
100
-
101
-
102
-
103
-
104
-
105
-
106
-
107
-
108
-
109
-
110
-
111
-
112
-
113
-
114
-
115
-
116
-
117
-
118
-
119
-
120
-
121
-
122
-
123
-
124
-
125
-
126
-
127
-
128
-
129
-
130
-
131
-
132
-
133
-
134
-
135
-
136
-
137
-
138
-
139
-
140
-
141
-
142
-
143
-
144
-
145
-
146
-
147
-
148
-
149
-
150
-
151
-
152
-
153
-
154
-
155
-
156
-
157
-
158
-
159
-
160
-
161
 |
 |

charges are costs associated with the wind down of our web hosting service. Activities related to this wind down
are substantially complete; however, we continue to be obligated under facility leases that expire from 2007
through 2014.
In 2004, we recorded asset impairments of $3.5 billion related to our property, plant and equipment. We also
recorded charges of $121 million related to severance costs and termination of facility leases associated with our
transformation initiatives and the ongoing wind down of our web hosting service.
In 2003, we recorded asset impairments of $1.2 billion related to a decline in the fair value of our BRS spectrum.
The decision to wind down the web hosting service resulted in a $316 million asset impairment charge, and
associated restructuring charges of $60 million related to severance and facility lease terminations.
Additional information regarding our asset impairments can be found in note 8 of the Notes to the Consolidated
Financial Statements appearing at the end of this annual report on Form 10-K.
Depreciation Expense
Depreciation expense decreased 54% in 2005 and 25% in 2004. The decrease in both years was primarily driven
by the reduction in value of assets associated with the impairment of our property, plant and equipment in 2004,
as well as a decreased asset base due to the wind-down of the web hosting service in 2003. Additionally, in 2004,
we extended the depreciable life of certain high-capacity transmission equipment from eight years to twelve
years due to slower anticipated evolution of technology. This extension in life decreased the 2004 depreciation
expense by approximately $74 million. Depreciation expense was 7% of net operating revenues in 2005, 15% in
2004, and 18% in 2003.
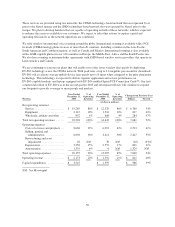
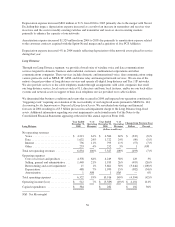
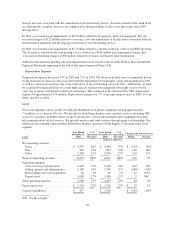
Local
Our Local segment consists mainly of regulated incumbent local phone companies serving approximately
7.4 million access lines in 18 states. We provide local and long distance voice and data services, including DSL,
access by customers and other carriers to the local network, sales of telecommunications equipment and other
telecommunications related services. We provide wireless and video services through agency relationships. Our
wholesale telecommunications product distribution business, known as North Supply, is also part of the Local
segment.
Local
Year Ended
December 31,
2005
%of
Operating
Revenues
Year Ended
December 31,
2004
%of
Operating
Revenues
Change from Previous Year
Dollars Percent
(dollars in millions)
Net operating revenues
Voice .......................... $ 4,335 66% $ 4,498 70% $ (163) (4)%
Data ........................... 983 15% 833 13% 150 18%
Other .......................... 1,209 19% 1,090 17% 119 11%
Total net operating revenues .......... 6,527 100% 6,421 100% 106 2%
Operating expenses
Costs of services and products ....... 2,407 37% 2,198 34% 209 10%
Selling, general and administrative . . . 1,190 18% 1,358 21% (168) (12)%
Restructuring and asset impairment . . 82 1% 40 1% 42 105%
Depreciation ..................... 1,090 17% 1,089 17% 1 NM
Total operating expenses ............. 4,769 73% 4,685 73% 84 2%
Operating income .................. $ 1,758 27% $ 1,736 27% $ 22 1%
Capital expenditures ................ $ 857 $ 1,018 $ (161) (16)%
NM: Not Meaningful
59