Sprint - Nextel 2005 Annual Report Download - page 47
Download and view the complete annual report
Please find page 47 of the 2005 Sprint - Nextel annual report below. You can navigate through the pages in the report by either clicking on the pages listed below, or by using the keyword search tool below to find specific information within the annual report.-
 1
1 -
2
-
3
-
4
-
5
-
6
-
7
-
8
-
9
-
10
-
11
-
12
-
13
-
14
-
15
-
16
-
17
-
18
-
19
-
20
-
21
-
22
-
23
-
24
-
25
-
26
-
27
-
28
-
29
-
30
-
31
-
32
-
33
-
34
-
35
-
36
-
 37
37 -
 38
38 -
 39
39 -
 40
40 -
 41
41 -
 42
42 -
 43
43 -
 44
44 -
 45
45 -
 46
46 -
 47
47 -
 48
48 -
 49
49 -
 50
50 -
 51
51 -
 52
52 -
 53
53 -
 54
54 -
 55
55 -
 56
56 -
 57
57 -
58
-
59
-
60
-
61
-
62
-
63
-
64
-
65
-
66
-
67
-
68
-
69
-
70
-
71
-
72
-
73
-
74
-
75
-
76
-
77
-
78
-
79
-
80
-
81
-
82
-
83
-
84
-
85
-
86
-
87
-
88
-
89
-
90
-
91
-
92
-
93
-
94
-
95
-
96
-
97
-
98
-
99
-
100
-
101
-
102
-
103
-
104
-
105
-
106
-
107
-
108
-
109
-
110
-
111
-
112
-
113
-
114
-
115
-
116
-
117
-
118
-
119
-
120
-
121
-
122
-
123
-
124
-
125
-
126
-
127
-
128
-
129
-
130
-
131
-
132
-
133
-
134
-
135
-
136
-
137
-
138
-
139
-
140
-
141
-
142
-
143
-
144
-
145
-
146
-
147
-
148
-
149
-
150
-
151
-
152
-
153
-
154
-
155
-
156
-
157
-
158
-
159
-
160
-
161
 |
 |

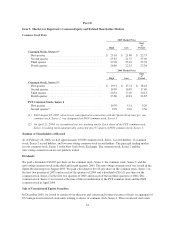
Item 6. Selected Financial Data
The 2005 data presented below is not comparable to that of the prior periods as a result of our acquisitions during
the year, particularly the acquisition of Nextel, which closed in August 2005. The acquired companies’ financial
results subsequent to their acquisition dates are included in our consolidated financial statements.
Year Ended December 31,
2005 2004 2003 2002 2001
(in millions, except per share amounts)
Results of Operations
Net operating revenues ............... $ 34,680 $ 27,428 $ 26,197 $ 26,679 $ 25,562
Depreciation ....................... 4,933 4,713 4,972 4,886 4,194
Amortization ....................... 1,336714382
Operating income (loss)(1)(2) .......... 3,826 (303) 1,007 2,096 (910)
Income (loss) from continuing
operations(1)(2) .................... 1,801 (1,012) (292) 451 (1,599)
Earnings (Loss) per Share and
Dividends
Basic earnings (loss) per common share
from continuing operations(1)(2)(3)(4) . . . 0.88 (0.71) (0.21) 0.32 (1.16)
Diluted earnings (loss) per common share
from continuing operations(1)(2)(3)(4) . . . 0.87 (0.71) (0.21) 0.32 (1.16)
Dividends per common share(5)(6) ....... 0.30 Note 7 Note 7 Note 7 Note 7
Financial Position
Total assets ........................ $ 102,580 $ 41,321 $ 42,675 $ 45,113 $ 45,619
Property, plant and equipment, net ..... 31,133 22,628 27,101 28,565 28,786
Intangible assets, net ................ 49,334 7,836 7,815 9,045 9,060
Total debt and capital lease obligations
(including equity unit notes) ........ 25,679 17,204 19,160 22,017 22,627
Redeemable preferred stock ........... 247 247 247 256 256
Shareholders’ equity ................. 51,937 13,521 13,113 12,108 12,450
Cash Flow Data
Net cash from operating activities ...... $ 10,678 $ 6,625 $ 6,535 $ 6,332 $ 4,663
Capital expenditures ................. 5,057 3,980 3,797 4,821 8,982
The tables above set forth selected consolidated financial data for the periods or as of the dates indicated and
should be read in conjunction with the consolidated financial statements, related notes and other financial
information appearing at the end of this annual report on Form 10-K. Highlighted below are certain transactions
and factors that may be significant to an understanding of our financial condition and comparability of results of
operations.
(1) In 2005, we recorded net charges reducing our operating income by $844 million and income from
continuing operations by $520 million. These charges related to merger and integration costs, asset
impairments, restructurings, and hurricane - related costs.
In 2004, we recorded charges reducing our operating income by $3.7 billion to an operating loss and
reducing income from continuing operations by $2.3 billion to an overall loss from continuing operations.
The charges related primarily to restructurings and a Long Distance network impairment, partially offset by
recoveries of fully reserved MCI (now Verizon) receivables.
In 2003, we recorded net charges reducing our operating income by $1.9 billion and reducing income from
continuing operations by $1.2 billion, resulting in an overall loss from continuing operations. The charges
related primarily to restructurings, asset impairments, and executive separation agreements, offset by
recoveries of fully reserved MCI (now Verizon) receivables.
36