Sprint - Nextel 2005 Annual Report Download - page 67
Download and view the complete annual report
Please find page 67 of the 2005 Sprint - Nextel annual report below. You can navigate through the pages in the report by either clicking on the pages listed below, or by using the keyword search tool below to find specific information within the annual report.-
 1
1 -
2
-
3
-
4
-
5
-
6
-
7
-
8
-
9
-
10
-
11
-
12
-
13
-
14
-
15
-
16
-
17
-
18
-
19
-
20
-
21
-
22
-
23
-
24
-
25
-
26
-
27
-
28
-
29
-
30
-
31
-
32
-
33
-
34
-
35
-
36
-
37
-
38
-
39
-
40
-
41
-
42
-
43
-
44
-
45
-
46
-
47
-
48
-
49
-
50
-
51
-
52
-
53
-
54
-
55
-
56
-
 57
57 -
 58
58 -
 59
59 -
 60
60 -
 61
61 -
 62
62 -
 63
63 -
 64
64 -
 65
65 -
 66
66 -
 67
67 -
 68
68 -
 69
69 -
 70
70 -
 71
71 -
 72
72 -
 73
73 -
 74
74 -
 75
75 -
 76
76 -
 77
77 -
78
-
79
-
80
-
81
-
82
-
83
-
84
-
85
-
86
-
87
-
88
-
89
-
90
-
91
-
92
-
93
-
94
-
95
-
96
-
97
-
98
-
99
-
100
-
101
-
102
-
103
-
104
-
105
-
106
-
107
-
108
-
109
-
110
-
111
-
112
-
113
-
114
-
115
-
116
-
117
-
118
-
119
-
120
-
121
-
122
-
123
-
124
-
125
-
126
-
127
-
128
-
129
-
130
-
131
-
132
-
133
-
134
-
135
-
136
-
137
-
138
-
139
-
140
-
141
-
142
-
143
-
144
-
145
-
146
-
147
-
148
-
149
-
150
-
151
-
152
-
153
-
154
-
155
-
156
-
157
-
158
-
159
-
160
-
161
 |
 |

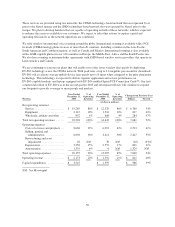
Depreciation expense increased $801 million or 31% from 2004 to 2005 primarily due to the merger with Nextel.
Excluding this impact, depreciation expense increased as a result of an increase in transmitter and receiver sites
in service and the costs to modify existing switches and transmitter and receiver sites in existing markets
primarily to enhance the capacity of our networks.
Amortization expense increased $1,329 million from 2004 to 2005 due primarily to amortization expense related
to the customer contracts acquired with the Sprint-Nextel merger and acquisition of five PCS Affiliates.
Depreciation expense increased 4% in 2004 mainly reflecting depreciation of the network assets placed in service
during that year.
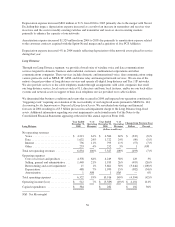
Long Distance
Through our Long Distance segment, we provide a broad suite of wireline voice and data communications
services targeted to domestic business and residential customers, multinational corporations and other
communications companies. These services include domestic and international voice, data communications using
various protocols such as MPLS, IP, ATM, and frame relay and managed network services. We are one of the
nation’s largest providers of long distance services and operate all-digital long distance and Tier 1 IP networks.
We also provide services to the cable telephony market through arrangements with cable companies that resell
our long distance service, local services such as 911, directory and basic local features, and/or use our back office
systems and network assets in support of their local telephone service provided over cable facilities.
We determined that business conditions and events that occurred in 2004 and impacted our operations constituted a
“triggering event” requiring an evaluation of the recoverability of our long-lived assets pursuant to SFAS No. 144,
Accounting for the Impairment or Disposal of Long-Lived Assets. We reevaluated our strategy and financial
forecasts in 2004 resulting in a $3.5 billion pre-tax non-cash impairment charge to the Long Distance long-lived
assets. Additional information regarding our asset impairments can be found in note 8 of the Notes to the
Consolidated Financial Statements appearing at the end of this annual report on Form 10-K.
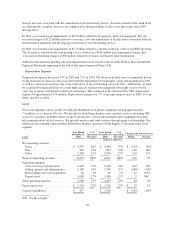
Long Distance
Year Ended
December 31,
2005
%of
Operating
Revenues
Year Ended
December 31,
2004
%of
Operating
Revenues
Change from Previous Year
Dollars Percent
(dollars in millions)
Net operating revenues
Voice .......................... $ 4,213 61% $ 4,560 62% $ (347) (8)%
Data ........................... 1,632 24% 1,722 24% (90) (5)%
Internet ......................... 736 11% 793 11% (57) (7)%
Other .......................... 253 4% 252 3% 1 NM
Total net operating revenues .......... 6,834 100% 7,327 100% (493) (7)%
Operating expenses
Costs of services and products ....... 4,378 64% 4,249 58% 129 3%
Selling, general and administrative . . . 1,440 21% 1,935 26% (495) (26)%
Restructuring and asset impairment . . 15 1% 3,661 50% (3,646) (100)%
Depreciation ..................... 488 7% 1,070 15% (582) (54)%
Amortization .................... 1 NM 1NM —0%
Total operating expenses ............. 6,322 93% 10,916 149% (4,594) (42)%
Operating income (loss) .............. $ 512 7% $ (3,589) (49)% $ 4,101 114%
Capital expenditures ................ $ 384 $ 282 $ 102 36%
NM: Not Meaningful
56