Sprint - Nextel 2005 Annual Report Download - page 61
Download and view the complete annual report
Please find page 61 of the 2005 Sprint - Nextel annual report below. You can navigate through the pages in the report by either clicking on the pages listed below, or by using the keyword search tool below to find specific information within the annual report.-
 1
1 -
2
-
3
-
4
-
5
-
6
-
7
-
8
-
9
-
10
-
11
-
12
-
13
-
14
-
15
-
16
-
17
-
18
-
19
-
20
-
21
-
22
-
23
-
24
-
25
-
26
-
27
-
28
-
29
-
30
-
31
-
32
-
33
-
34
-
35
-
36
-
37
-
38
-
39
-
40
-
41
-
42
-
43
-
44
-
45
-
46
-
47
-
48
-
49
-
50
-
 51
51 -
 52
52 -
 53
53 -
 54
54 -
 55
55 -
 56
56 -
 57
57 -
 58
58 -
 59
59 -
 60
60 -
 61
61 -
 62
62 -
 63
63 -
 64
64 -
 65
65 -
 66
66 -
 67
67 -
 68
68 -
 69
69 -
 70
70 -
 71
71 -
72
-
73
-
74
-
75
-
76
-
77
-
78
-
79
-
80
-
81
-
82
-
83
-
84
-
85
-
86
-
87
-
88
-
89
-
90
-
91
-
92
-
93
-
94
-
95
-
96
-
97
-
98
-
99
-
100
-
101
-
102
-
103
-
104
-
105
-
106
-
107
-
108
-
109
-
110
-
111
-
112
-
113
-
114
-
115
-
116
-
117
-
118
-
119
-
120
-
121
-
122
-
123
-
124
-
125
-
126
-
127
-
128
-
129
-
130
-
131
-
132
-
133
-
134
-
135
-
136
-
137
-
138
-
139
-
140
-
141
-
142
-
143
-
144
-
145
-
146
-
147
-
148
-
149
-
150
-
151
-
152
-
153
-
154
-
155
-
156
-
157
-
158
-
159
-
160
-
161
 |
 |

These services are provided using two networks, the CDMA technology-based network that was operated by us
prior to the Nextel merger and the iDEN technology-based network that was operated by Nextel prior to the
merger. We plan to develop handsets that are capable of operating on both of these networks, which is expected
to enhance the services available to our customers. We expect to take other actions to capture capital and
operating efficiencies as the network operations are combined.
We offer wireless international voice roaming around the globe. International roaming is available with a PCS
tri-mode (CDMA/analog) phone in areas of more than 40 countries, including countries in the Asia-Pacific,
South American and Caribbean regions, as well as Canada and Mexico. International roaming is also available
with a GSM-capable phone in over 140 countries in Europe, the Middle East, Africa and the South Pacific rim.
We also have roaming or interoperability agreements with iDEN-based wireless service providers that operate in
Latin America and Canada.
We are continuing to execute our plans that will enable us to offer faster wireless data speeds by deploying
EV-DO technology across the CDMA network. With peak rates of up to 2.4 megabits per second for downloads,
EV-DO will accelerate average mobile-device data speeds up to 10 times when compared to the prior generation
technology. This technology is expected to deliver superior application and service performance on
EV-DO-capable handsets and laptops equipped with EV-DO-enabled Sprint PCS Connection Cards™. Our first
commercial rollout of EV-DO was in the second quarter 2005 and subsequent rollouts will continue to expand
our footprint to provide coverage to more people and markets.
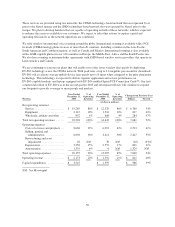
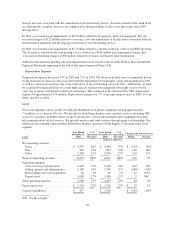
Wireless
Year Ended
December 31,
2005
%of
Operating
Revenues
Year Ended
December 31,
2004
%of
Operating
Revenues
Change from Previous Year
Dollars Percent
(dollars in millions)
Net operating revenues
Service ..................... $ 19,289 86% $ 12,529 86% $ 6,760 54%
Equipment .................. 2,147 10% 1,510 10% 637 42%
Wholesale, affiliate and other . . . 892 4% 608 4% 284 47%
Total net operating revenues ...... 22,328 100% 14,647 100% 7,681 52%
Operating expenses
Costs of services and products . . . 8,604 39% 6,091 42% 2,513 41%
Selling, general and
administrative ............. 6,838 30% 4,411 30% 2,427 55%
Restructuring and asset
impairment ................ 20 NM 30 NM (10) (33)%
Depreciation ................. 3,358 15% 2,557 17% 801 31%
Amortization ................ 1,335 6% 6 NM 1,329 NM
Total operating expenses ......... 20,155 90% 13,095 89% 7,060 54%
Operating income .............. $ 2,173 10% $ 1,552 11% $ 621 40%
Capital expenditures ............ $ 3,545 $ 2,559 $ 986 39%
NM: Not Meaningful
50