Sprint - Nextel 2005 Annual Report Download - page 69
Download and view the complete annual report
Please find page 69 of the 2005 Sprint - Nextel annual report below. You can navigate through the pages in the report by either clicking on the pages listed below, or by using the keyword search tool below to find specific information within the annual report.-
 1
1 -
2
-
3
-
4
-
5
-
6
-
7
-
8
-
9
-
10
-
11
-
12
-
13
-
14
-
15
-
16
-
17
-
18
-
19
-
20
-
21
-
22
-
23
-
24
-
25
-
26
-
27
-
28
-
29
-
30
-
31
-
32
-
33
-
34
-
35
-
36
-
37
-
38
-
39
-
40
-
41
-
42
-
43
-
44
-
45
-
46
-
47
-
48
-
49
-
50
-
51
-
52
-
53
-
54
-
55
-
56
-
57
-
58
-
 59
59 -
 60
60 -
 61
61 -
 62
62 -
 63
63 -
 64
64 -
 65
65 -
 66
66 -
 67
67 -
 68
68 -
 69
69 -
 70
70 -
 71
71 -
 72
72 -
 73
73 -
 74
74 -
 75
75 -
 76
76 -
 77
77 -
 78
78 -
 79
79 -
80
-
81
-
82
-
83
-
84
-
85
-
86
-
87
-
88
-
89
-
90
-
91
-
92
-
93
-
94
-
95
-
96
-
97
-
98
-
99
-
100
-
101
-
102
-
103
-
104
-
105
-
106
-
107
-
108
-
109
-
110
-
111
-
112
-
113
-
114
-
115
-
116
-
117
-
118
-
119
-
120
-
121
-
122
-
123
-
124
-
125
-
126
-
127
-
128
-
129
-
130
-
131
-
132
-
133
-
134
-
135
-
136
-
137
-
138
-
139
-
140
-
141
-
142
-
143
-
144
-
145
-
146
-
147
-
148
-
149
-
150
-
151
-
152
-
153
-
154
-
155
-
156
-
157
-
158
-
159
-
160
-
161
 |
 |
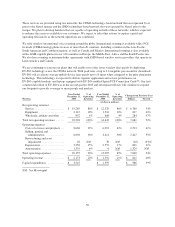
and ATM declined due to customers migrating to IP-based technologies. These declines were partially offset by
growth in managed network services. In 2004, the decrease in frame relay and private line services was partially
offset by an increase in ATM and managed network services.
Internet Revenues
Internet revenues decreased 7% in 2005 and 18% in 2004. The 2005 decline was primarily due to the loss of the
Dial IP revenues due to the sale of our Dial IP business in October 2004. These revenues were partially replaced
by an increase in dedicated IP revenue as customers migrated from ATM and frame relay technologies to next
generation MPLS technologies. The decline in 2004 was the result of a decrease in Dial IP revenues and the
discontinuation of our web hosting service, partially offset by an increase in dedicated IP revenue .
Other Revenues
Other revenues remained flat in 2005 after increasing 40% in 2004. The 2004 increase was primarily due to
higher equipment sales.
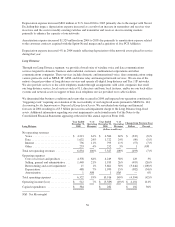
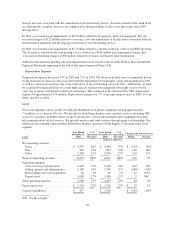
Costs of Services and Products
Costs of services and products include access costs paid to local phone companies (including our Local segment),
other domestic service providers and foreign phone companies to complete calls made by our domestic
customers, costs to operate and maintain our networks, and costs of equipment. Costs of services and products
increased 3% in 2005 and 2% in 2004. The 2005 increase was driven by access volume and international access
costs, somewhat offset by renegotiated access rate agreements and initiatives to reduce access unit costs. These
costs were partially offset by the recognition of a portion of the deferred gain from the sale of the conferencing
business, which was sold in June 2005. The 2004 increase was primarily attributable to higher access volume,
somewhat offset by renegotiated access rate agreements and initiatives to reduce access unit costs.
Costs of services and products were 64% of net operating revenues in 2005, 58% in 2004 and 52% in 2003.
These increases occurred as a result of the overall reductions in net operating revenues.
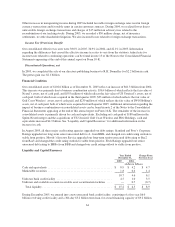
Selling, General and Administrative Expense
Selling, general and administrative expense decreased 26% in 2005 and 15% in 2004. The 2005 decline was due
primarily to continued restructuring efforts, headcount reductions, aggressive cost savings initiatives, reduced
rent costs and lower bad debt expense in the wholesale markets. The 2004 decline was due to restructuring efforts
and general cost controls.
Selling, general and administrative expense includes charges for estimated bad debt expense. The reserve for bad
debt requires management’s judgment and is based on customer-specific indicators, as well as historical trending,
industry norms and recognition of current market indicators about general economic conditions. Bad debt
expense as a percentage of net operating revenues was less than 1% in 2005, 2% in 2004, and 1% in 2003. The
reserve for bad debt as a percentage of outstanding accounts receivable was 8% in 2005, 12% in 2004 and 11% in
2003.
Total selling general and administrative expense was 21% of net operating revenues in 2005, 26% in 2004, and
28% in 2003.
Restructuring and Asset Impairments
In 2005, we recorded restructuring and asset impairment charges of $15 million, of which $9 million related to
the write-off of certain internal-use software systems that are no longer being utilized. The remaining
58