Sprint - Nextel 2005 Annual Report Download - page 155
Download and view the complete annual report
Please find page 155 of the 2005 Sprint - Nextel annual report below. You can navigate through the pages in the report by either clicking on the pages listed below, or by using the keyword search tool below to find specific information within the annual report.-
 1
1 -
2
-
3
-
4
-
5
-
6
-
7
-
8
-
9
-
10
-
11
-
12
-
13
-
14
-
15
-
16
-
17
-
18
-
19
-
20
-
21
-
22
-
23
-
24
-
25
-
26
-
27
-
28
-
29
-
30
-
31
-
32
-
33
-
34
-
35
-
36
-
37
-
38
-
39
-
40
-
41
-
42
-
43
-
44
-
45
-
46
-
47
-
48
-
49
-
50
-
51
-
52
-
53
-
54
-
55
-
56
-
57
-
58
-
59
-
60
-
61
-
62
-
63
-
64
-
65
-
66
-
67
-
68
-
69
-
70
-
71
-
72
-
73
-
74
-
75
-
76
-
77
-
78
-
79
-
80
-
81
-
82
-
83
-
84
-
85
-
86
-
87
-
88
-
89
-
90
-
91
-
92
-
93
-
94
-
95
-
96
-
97
-
98
-
99
-
100
-
101
-
102
-
103
-
104
-
105
-
106
-
107
-
108
-
109
-
110
-
111
-
112
-
113
-
114
-
115
-
116
-
117
-
118
-
119
-
120
-
121
-
122
-
123
-
124
-
125
-
126
-
127
-
128
-
129
-
130
-
131
-
132
-
133
-
134
-
135
-
136
-
137
-
138
-
139
-
140
-
141
-
142
-
143
-
144
-
 145
145 -
 146
146 -
 147
147 -
 148
148 -
 149
149 -
 150
150 -
 151
151 -
 152
152 -
 153
153 -
 154
154 -
 155
155 -
 156
156 -
 157
157 -
 158
158 -
 159
159 -
 160
160 -
 161
161
 |
 |

SPRINT NEXTEL CORPORATION
NOTES TO THE CONSOLIDATED FINANCIAL STATEMENTS — (Continued)
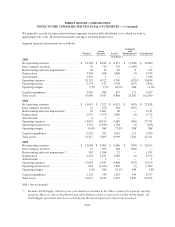
We generally account for transactions between segments based on fully distributed costs, which we believe
approximate fair value. In certain transactions, pricing is set using market rates.
Segment financial information was as follows:
Wireless
Long
Distance Local(1)
Corporate
and
Eliminations(2) Consolidated
(in millions)
2005
Net operating revenues .................... $ 22,328 $ 6,834 $ 6,527 $ (1,009) $ 34,680
Inter-company revenues ................... 29 710 270 (1,009) —
Restructuring and asset impairments(3) ....... 20 15 82 8 125
Depreciation ............................ 3,358 488 1,090 (3) 4,933
Amortization ............................ 1,335 1 — — 1,336
Operating expenses ...................... 20,155 6,322 4,769 (392)(4) 30,854
Operating income ........................ 2,173 512 1,758 (617) 3,826
Operating margin ........................ 9.7% 7.5% 26.9% NM 11.0%
Capital expenditures ...................... 3,545 384 857 271 5,057
Total assets ............................. 67,090 3,437 8,848 23,205 102,580
2004
Net operating revenues .................... $ 14,647 $ 7,327 $ 6,421 $ (967) $ 27,428
Inter-company revenues ................... 27 678 262 (967) —
Restructuring and asset impairments(3) ....... 30 3,661 40 — 3,731
Depreciation ............................ 2,557 1,070 1,089 (3) 4,713
Amortization ............................ 6 1 — — 7
Operating expenses ....................... 13,095 10,916 4,685 (965) 27,731
Operating income (loss) ................... 1,552 (3,589) 1,736 (2) (303)
Operating margin ........................ 10.6% NM 27.0% NM NM
Capital expenditures ...................... 2,559 282 1,018 121 3,980
Total assets ............................. 21,417 3,695 8,999 7,210 41,321
2003
Net operating revenues .................... $ 12,690 $ 8,005 $ 6,486 $ (984) $ 26,197
Inter-company revenues ................... 25 693 266 (984) —
Restructuring and asset impairments(3) ....... 362 1,564 25 — 1,951
Depreciation ............................ 2,454 1,431 1,089 (2) 4,972
Amortization ............................ — 1 — — 1
Operating expenses ....................... 12,056 9,447 4,666 (979) 25,190
Operating income (loss) ................... 634 (1,442) 1,820 (5) 1,007
Operating margin ........................ 5.0% NM 28.1% NM 3.8%
Capital expenditures ...................... 2,123 339 1,201 134 3,797
Total assets ............................. 21,671 8,232 9,075 3,696 42,674
NM = Not meaningful
(1) Includes North Supply, which in prior years had been included in the Other segment for segment reporting
purposes. However, due to the planned spin off of Embarq, which is expected to include North Supply, the
North Supply operations have been reclassified to the Local segment for all periods presented.
F-60