Sprint - Nextel 2005 Annual Report Download - page 64
Download and view the complete annual report
Please find page 64 of the 2005 Sprint - Nextel annual report below. You can navigate through the pages in the report by either clicking on the pages listed below, or by using the keyword search tool below to find specific information within the annual report.-
 1
1 -
2
-
3
-
4
-
5
-
6
-
7
-
8
-
9
-
10
-
11
-
12
-
13
-
14
-
15
-
16
-
17
-
18
-
19
-
20
-
21
-
22
-
23
-
24
-
25
-
26
-
27
-
28
-
29
-
30
-
31
-
32
-
33
-
34
-
35
-
36
-
37
-
38
-
39
-
40
-
41
-
42
-
43
-
44
-
45
-
46
-
47
-
48
-
49
-
50
-
51
-
52
-
53
-
 54
54 -
 55
55 -
 56
56 -
 57
57 -
 58
58 -
 59
59 -
 60
60 -
 61
61 -
 62
62 -
 63
63 -
 64
64 -
 65
65 -
 66
66 -
 67
67 -
 68
68 -
 69
69 -
 70
70 -
 71
71 -
 72
72 -
 73
73 -
 74
74 -
75
-
76
-
77
-
78
-
79
-
80
-
81
-
82
-
83
-
84
-
85
-
86
-
87
-
88
-
89
-
90
-
91
-
92
-
93
-
94
-
95
-
96
-
97
-
98
-
99
-
100
-
101
-
102
-
103
-
104
-
105
-
106
-
107
-
108
-
109
-
110
-
111
-
112
-
113
-
114
-
115
-
116
-
117
-
118
-
119
-
120
-
121
-
122
-
123
-
124
-
125
-
126
-
127
-
128
-
129
-
130
-
131
-
132
-
133
-
134
-
135
-
136
-
137
-
138
-
139
-
140
-
141
-
142
-
143
-
144
-
145
-
146
-
147
-
148
-
149
-
150
-
151
-
152
-
153
-
154
-
155
-
156
-
157
-
158
-
159
-
160
-
161
 |
 |
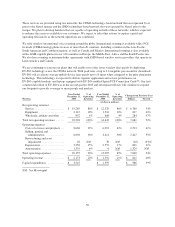
in 2005, ending the year with 5.2 million subscribers. The PCS Affiliates ended 2005 with 2.8 million
subscribers, which has been adjusted for the subscriber transfers resulting from the acquisition of three PCS
Affiliates during the year. We expect revenue from the remaining PCS Affiliates in 2006 to be significantly
lower than 2005 because of the five PCS Affiliates that we purchased in 2005, and the first quarter 2006.
Wholesale revenues are expected to increase year over year due to continued subscriber growth of existing
resellers as well as the addition of new resellers, during 2006. See “—Forward Looking Statements.”
Service revenues increased $1.3 billion or 12% in 2004 compared to 2003, mainly reflecting an increase in the
number of direct subscribers, increased revenue from data services and subscriber elections to add services to
their base plans. These increases were partially offset by lower overage charges from usage-based plans. We had
1.9 million direct net subscriber additions in 2004, including 91,000 subscribers acquired from a PCS Affiliate,
and we ended 2004 with 17.8 million direct subscribers.
Revenues from sales of handsets and accessories increased $367 million or 32% in 2004 compared to 2003
mainly due to higher subscriber additions and higher retail prices, which were partially offset by higher rebates.
Wholesale, affiliate and other service revenues represented 4% of net operating revenues in 2004 and 3% in
2003. The $278 million increase in 2004 mainly reflects the net additions in the wholesale and PCS Affiliate
bases. Wholesale operators added 2.1 million subscribers in 2004, increasing their subscriber base to 3.7 million
from 1.6 million in 2003, principally driven by Virgin Mobile USA and Qwest Communications. The PCS
Affiliates added 374,000 subscribers in 2004, ending the year with 3.2 million subscribers.
Costs of Services and Products
Costs of services and products consist of our cost of providing wireless service and cost of our handset and
accessory revenues. Cost of providing wireless service consists primarily of:
• costs to operate and maintain our CDMA and iDEN networks, primarily including direct switch and
transmitter and receiver site costs, such as rent, utilities, property taxes and maintenance; payroll and
facilities costs associated with our network engineering employees; frequency leasing costs; and roaming
fees paid to other carriers;
• fixed and variable interconnection costs, the fixed component of which consists of monthly flat-rate fees
for facilities leased from local exchange carriers based on the number of transmitter and receiver sites and
switches in service in a particular period and the related equipment installed at each site; and the variable
component of which generally consists of per-minute use fees charged by wireline and wireless providers
for calls terminating on their networks, which fluctuates in relation to the level and duration of those
terminating calls; and
• costs to activate service for new subscribers.
Cost of handset and accessory revenues consists primarily of the cost of the handsets and accessories sold, order
fulfillment related expenses and write-downs of handset and related accessory inventory for shrinkage. We
recognize the cost of handset revenues, including the handset costs in excess of the revenues generated from
handset sales and accessory revenues when title to the handset or accessory passes to the dealer or end-user
customer.
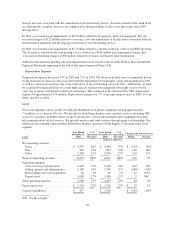
Cost of service was 58% of total costs of services and products in 2005 compared to 54% in 2004. These costs
increased $1,688 million or 52% from 2004 to 2005 primarily due to the merger with Nextel as well as increased
costs relating to the expansion of our network and increased minutes of use on our networks. Specifically we
experienced:
• an increase in transmitter and receiver and switch related operational costs due to the increase in
transmitter and receiver sites and capacity enhancements placed into service during 2005;
53