Sprint - Nextel 2005 Annual Report Download - page 62
Download and view the complete annual report
Please find page 62 of the 2005 Sprint - Nextel annual report below. You can navigate through the pages in the report by either clicking on the pages listed below, or by using the keyword search tool below to find specific information within the annual report.-
 1
1 -
2
-
3
-
4
-
5
-
6
-
7
-
8
-
9
-
10
-
11
-
12
-
13
-
14
-
15
-
16
-
17
-
18
-
19
-
20
-
21
-
22
-
23
-
24
-
25
-
26
-
27
-
28
-
29
-
30
-
31
-
32
-
33
-
34
-
35
-
36
-
37
-
38
-
39
-
40
-
41
-
42
-
43
-
44
-
45
-
46
-
47
-
48
-
49
-
50
-
51
-
 52
52 -
 53
53 -
 54
54 -
 55
55 -
 56
56 -
 57
57 -
 58
58 -
 59
59 -
 60
60 -
 61
61 -
 62
62 -
 63
63 -
 64
64 -
 65
65 -
 66
66 -
 67
67 -
 68
68 -
 69
69 -
 70
70 -
 71
71 -
 72
72 -
73
-
74
-
75
-
76
-
77
-
78
-
79
-
80
-
81
-
82
-
83
-
84
-
85
-
86
-
87
-
88
-
89
-
90
-
91
-
92
-
93
-
94
-
95
-
96
-
97
-
98
-
99
-
100
-
101
-
102
-
103
-
104
-
105
-
106
-
107
-
108
-
109
-
110
-
111
-
112
-
113
-
114
-
115
-
116
-
117
-
118
-
119
-
120
-
121
-
122
-
123
-
124
-
125
-
126
-
127
-
128
-
129
-
130
-
131
-
132
-
133
-
134
-
135
-
136
-
137
-
138
-
139
-
140
-
141
-
142
-
143
-
144
-
145
-
146
-
147
-
148
-
149
-
150
-
151
-
152
-
153
-
154
-
155
-
156
-
157
-
158
-
159
-
160
-
161
 |
 |

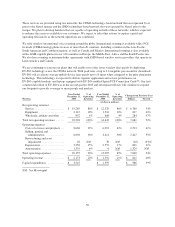
Wireless
Year Ended
December 31,
2004
%of
Operating
Revenues
Year Ended
December 31,
2003
%of
Operating
Revenues
Change from Previous Year
Dollars Percent
(dollars in millions)
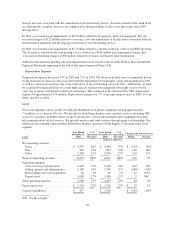
Net operating revenues
Service ......................... $ 12,529 86% $ 11,217 88% $ 1,312 12%
Equipment ...................... 1,510 10% 1,143 9% 367 32%
Wholesale, affiliate and other ....... 608 4% 330 3% 278 84%
Total net operating revenues .......... 14,647 100% 12,690 100% 1,957 15%
Operating expenses
Costs of services and products ....... 6,091 42% 5,162 41% 929 18%
Selling, general and administrative . . . 4,411 30% 4,078 32% 333 8%
Restructuring and asset impairment . . 30 NM 362 3% (332) (92)%
Depreciation ..................... 2,557 17% 2,454 19% 103 4%
Amortization .................... 6 NM —— 6 NM
Total operating expenses ............. 13,095 89% 12,056 95% 1,039 9%
Operating income .................. $ 1,552 11% $ 634 5% $ 918 145%
Capital expenditures ................ $ 2,559 $ 2,123 $ 436 21%
NM: Not Meaningful
The following results are included in the results of our Wireless segment through December 31, 2005: the results
of Nextel from the August 12, 2005 date of completion of the merger; the results of US Unwired from the
August 12, 2005 date of the acquisition; the results of Gulf Coast Wireless from the October 3, 2005 date of
acquisition; and the results of IWO Holdings from the October 20, 2005 date of acquisition.
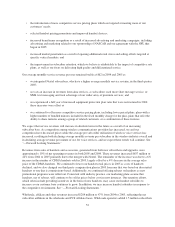
Net Operating Revenues
For the Year Ended December 31,
2005 2004 2003
Direct subscribers, end of period (millions) ................... 39.7 17.8 15.9
Direct net subscriber additions (millions) ..................... 3.0 1.9 1.1
Customer churn rate ...................................... 2.3% 2.6% 2.7%
Average monthly service revenue per user ..................... $ 62 $ 62 $ 61
Net operating revenues primarily consist of direct wireless service revenues, revenues from handset and
accessory sales and revenues from arrangements with wholesale operators and PCS Affiliates. Service revenues
consist of fixed monthly recurring charges, variable usage charges, charges related to the use of specified features
and miscellaneous fees such as directory assistance, operator-assisted calling, equipment protection, late payment
charges, and certain regulatory fees. Wholesale, affiliate and other revenues consist primarily of net revenues
retained from wireless subscribers residing in PCS Affiliate territories and revenues from the sale of wireless
services to companies that resell those services to their subscribers.
Service revenues increased $6,760 million or 54% from 2004 to 2005 primarily due to the merger with Nextel
and the increase in the number of our direct subscribers, while our average monthly service revenue per user
remained flat. We had 3.0 million direct net subscriber additions in 2005, excluding Nextel or PCS Affiliate
subscriber additions that occurred prior to the Sprint-Nextel merger and the acquisitions of US Unwired, Gulf
Coast Wireless and IWO Holdings, and ended the year with 39.7 million direct subscribers. We believe that the
growth in direct subscribers, separate from the growth attributable to subscribers gained as part of the Sprint-
Nextel merger and PCS Affiliate acquisitions, is the result of a number of factors, principally:
• our differentiating products and services, particularly data-related services such as nationwide walkie-
talkie services, Sprint PowerVision, instant messaging and emails, sending and receiving pictures, playing
games with full-color graphics and polyphonic sounds and browsing the Internet wirelessly;
51