Sprint - Nextel 2005 Annual Report Download - page 66
Download and view the complete annual report
Please find page 66 of the 2005 Sprint - Nextel annual report below. You can navigate through the pages in the report by either clicking on the pages listed below, or by using the keyword search tool below to find specific information within the annual report.-
 1
1 -
2
-
3
-
4
-
5
-
6
-
7
-
8
-
9
-
10
-
11
-
12
-
13
-
14
-
15
-
16
-
17
-
18
-
19
-
20
-
21
-
22
-
23
-
24
-
25
-
26
-
27
-
28
-
29
-
30
-
31
-
32
-
33
-
34
-
35
-
36
-
37
-
38
-
39
-
40
-
41
-
42
-
43
-
44
-
45
-
46
-
47
-
48
-
49
-
50
-
51
-
52
-
53
-
54
-
55
-
 56
56 -
 57
57 -
 58
58 -
 59
59 -
 60
60 -
 61
61 -
 62
62 -
 63
63 -
 64
64 -
 65
65 -
 66
66 -
 67
67 -
 68
68 -
 69
69 -
 70
70 -
 71
71 -
 72
72 -
 73
73 -
 74
74 -
 75
75 -
 76
76 -
77
-
78
-
79
-
80
-
81
-
82
-
83
-
84
-
85
-
86
-
87
-
88
-
89
-
90
-
91
-
92
-
93
-
94
-
95
-
96
-
97
-
98
-
99
-
100
-
101
-
102
-
103
-
104
-
105
-
106
-
107
-
108
-
109
-
110
-
111
-
112
-
113
-
114
-
115
-
116
-
117
-
118
-
119
-
120
-
121
-
122
-
123
-
124
-
125
-
126
-
127
-
128
-
129
-
130
-
131
-
132
-
133
-
134
-
135
-
136
-
137
-
138
-
139
-
140
-
141
-
142
-
143
-
144
-
145
-
146
-
147
-
148
-
149
-
150
-
151
-
152
-
153
-
154
-
155
-
156
-
157
-
158
-
159
-
160
-
161
 |
 |
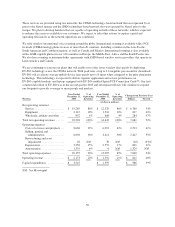
General and administrative costs increased $1,161 million or 54% from 2004 to 2005 primarily due to the merger
with Nextel, as well as:
• an increase in bad debt expense. The reserve for bad debt requires our judgment and is based on historical
trending, industry norms and recognition of current market indicators about general economic conditions.
Bad debt expense as a percentage of net operating revenues was 1.5% in 2005 and 1.4% in 2004. The
reserve for bad debt as a percent of outstanding accounts receivable was 6% in 2005 and 7% in 2004; and
• an increase in information technology and billing expenses to support a larger subscriber base in addition
to an increase in credit card fees as more subscribers submit invoice payments through credit cards;
partially offset by
• a decrease in our customer care costs as we outsourced more of our customer care calls to less expensive
service centers, which more than offset the increase in volume.
We expect the aggregate amount of selling, general and administrative expenses to continue increasing in
absolute terms in the future primarily as a result of increased costs to support a growing customer base, including
costs associated with billing, collection, customer retention and customer care activities. See “—Forward
Looking Statements.”
Selling, general and administrative expense increased 8% from 2003 to 2004, reflecting an increase in sales and
distribution costs primarily driven by higher gross additions and an increase in the number of direct retail stores.
Selling and marketing costs also contributed to the increase as a significant campaign was launched to reposition
the Sprint PCS brand in 2004. Selling, general and administrative expense was 30% of net operating revenues in
2004 and 32% in 2003. Bad debt expense as a percentage of net operating revenues was 1.4% in 2004 and 2.3%
in 2003. The reserve for bad debt as a percent of outstanding accounts receivable was 7% in both 2004 and 2003.
The stability of the 2004 percentage mainly reflects sales of previously written-off subscriber receivables and
reductions in reserves because number portability churn did not occur as anticipated.
Restructuring and Asset Impairment
In 2005, asset impairment charges of $27 million were recorded primarily related to the write-down of various
software applications. Restructuring credits of $7 million were the result of an analysis and finalization of
original estimates related to our organizational realignment initiated in 2003. We have completed substantially all
activities related to this realignment.
In 2004, we recorded a $30 million restructuring charge related to severance costs associated with our
organizational realignment.
In 2003, we recorded asset impairments of $349 million primarily related to the termination of development of a
new billing platform. We also recorded restructuring charges of $13 million for severance costs associated with
our organizational realignment, and contractual obligations related to the termination of the development of the
billing platform, partially offset by the finalization of all 2001 and 2002 restructuring activities.
Additional information regarding our asset impairments can be found in note 8 of the Notes to the Consolidated
Financial Statements appearing at the end of this annual report on Form 10-K.
Depreciation and Amortization Expense
Estimates and assumptions are used both in setting depreciable lives and testing for recoverability. Assumptions
are based on internal studies of use, industry data on lives, recognition of technological advancements and
understanding of business strategy. Depreciation expense consists mainly of depreciation of network assets.
Amortization expense consists mainly of amortization of customer relationship intangible assets.
55