Sprint - Nextel 2005 Annual Report Download - page 65
Download and view the complete annual report
Please find page 65 of the 2005 Sprint - Nextel annual report below. You can navigate through the pages in the report by either clicking on the pages listed below, or by using the keyword search tool below to find specific information within the annual report.-
 1
1 -
2
-
3
-
4
-
5
-
6
-
7
-
8
-
9
-
10
-
11
-
12
-
13
-
14
-
15
-
16
-
17
-
18
-
19
-
20
-
21
-
22
-
23
-
24
-
25
-
26
-
27
-
28
-
29
-
30
-
31
-
32
-
33
-
34
-
35
-
36
-
37
-
38
-
39
-
40
-
41
-
42
-
43
-
44
-
45
-
46
-
47
-
48
-
49
-
50
-
51
-
52
-
53
-
54
-
 55
55 -
 56
56 -
 57
57 -
 58
58 -
 59
59 -
 60
60 -
 61
61 -
 62
62 -
 63
63 -
 64
64 -
 65
65 -
 66
66 -
 67
67 -
 68
68 -
 69
69 -
 70
70 -
 71
71 -
 72
72 -
 73
73 -
 74
74 -
 75
75 -
76
-
77
-
78
-
79
-
80
-
81
-
82
-
83
-
84
-
85
-
86
-
87
-
88
-
89
-
90
-
91
-
92
-
93
-
94
-
95
-
96
-
97
-
98
-
99
-
100
-
101
-
102
-
103
-
104
-
105
-
106
-
107
-
108
-
109
-
110
-
111
-
112
-
113
-
114
-
115
-
116
-
117
-
118
-
119
-
120
-
121
-
122
-
123
-
124
-
125
-
126
-
127
-
128
-
129
-
130
-
131
-
132
-
133
-
134
-
135
-
136
-
137
-
138
-
139
-
140
-
141
-
142
-
143
-
144
-
145
-
146
-
147
-
148
-
149
-
150
-
151
-
152
-
153
-
154
-
155
-
156
-
157
-
158
-
159
-
160
-
161
 |
 |
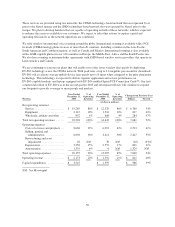
• increased long distance and roaming costs due to the increase in our direct subscriber base;
• higher PCS Affiliate and wholesale costs as the related subscriber bases increased throughout 2005;
• an increase in premium service fees resulting from increased subscriber data usage; and
• an increase in EV-DO backhaul costs driven by the increased capacity required to support the launch of
this service in 2005.
We expect the aggregate amount of cost of service to increase as customer usage of our networks increases and
we add more sites and other equipment to expand the coverage and capacity of our CDMA and iDEN networks.
See “—Forward Looking Statements”, “—Liquidity and Capital Resources” and “—Future Capital Needs and
Resources — Capital Needs — Capital Expenditures.”
Handset and accessory costs were 42% of total costs of services and products in 2005 compared to 46% in 2004.
These costs increased $825 million or 29% from 2004 to 2005 due to the merger with Nextel. Excluding this
impact, handset and accessory costs actually decreased from 2004 to 2005. The 6% increase in volume of CDMA
handsets sold during 2005 was more than offset by an 8% decrease in the average cost per handset. Additionally,
equipment refurbishment costs have declined since 2004 due to operational improvements in the handset
exchange and insurance programs as well as increased insurance deductibles implemented in early 2005 to offset
a portion of our costs.
Costs of services and products increased 18% from 2003 to 2004, primarily due to network support of a larger
subscriber base, higher minutes of use, expanded market coverage and increased handset costs. Handset and
accessory costs were 46% of total costs of services and products in 2004 and 2003, and costs of services and
products were 42% of net operating revenues in 2004 and 41% in 2003.
Selling, General and Administrative Expense
Selling and marketing costs primarily consist of customer acquisition costs, including commissions earned by our
indirect dealers, distributors and our direct sales force for new handset activations, residual payments to our
indirect dealers, payroll and facilities costs associated with our direct sales force, retail stores and marketing
employees, telemarketing, advertising, media programs and sponsorships, including costs related to branding.
General and administrative costs primarily consist of fees paid for billing, customer care and information
technology operations, bad debt expense and back office support activities, including customer retention,
collections, legal, finance, human resources, strategic planning and technology and product development, along
with the related payroll and facilities costs. Selling, general and administrative expense was 30% of net operating
revenues in 2005 and 2004.
Sales and marketing expense increased $1,266 million or 56% from 2004 to 2005 primarily due to the merger
with Nextel including the launch of new branding initiatives and advertising campaigns in connection with the
merger. The remaining increase in selling and marketing expense reflects:
• increased sales and distribution costs to support a larger direct subscriber base, as well as a shift in the
compensation of our third party dealers from a discounted handset-based plan to a commissions-based
plan that was implemented in 2005; and
• increased advertising and marketing costs, focusing on the customer experience, more corporate
sponsorships including the NFL and more media advertising associated with the merger and the launch of
our new “Yes You Can” brand campaign.
54