Symantec 2010 Annual Report Download - page 112
Download and view the complete annual report
Please find page 112 of the 2010 Symantec annual report below. You can navigate through the pages in the report by either clicking on the pages listed below, or by using the keyword search tool below to find specific information within the annual report.-
 1
1 -
2
-
3
-
4
-
5
-
6
-
7
-
8
-
9
-
10
-
11
-
12
-
13
-
14
-
15
-
16
-
17
-
18
-
19
-
20
-
21
-
22
-
23
-
24
-
25
-
26
-
27
-
28
-
29
-
30
-
31
-
32
-
33
-
34
-
35
-
36
-
37
-
38
-
39
-
40
-
41
-
42
-
43
-
44
-
45
-
46
-
47
-
48
-
49
-
50
-
51
-
52
-
53
-
54
-
55
-
56
-
57
-
58
-
59
-
60
-
61
-
62
-
63
-
64
-
65
-
66
-
67
-
68
-
69
-
70
-
71
-
72
-
73
-
74
-
75
-
76
-
77
-
78
-
79
-
80
-
81
-
82
-
83
-
84
-
85
-
86
-
87
-
88
-
89
-
90
-
91
-
92
-
93
-
94
-
95
-
96
-
97
-
98
-
99
-
100
-
101
-
 102
102 -
 103
103 -
 104
104 -
 105
105 -
 106
106 -
 107
107 -
 108
108 -
 109
109 -
 110
110 -
 111
111 -
 112
112 -
 113
113 -
 114
114 -
 115
115 -
 116
116 -
 117
117 -
 118
118 -
 119
119 -
 120
120 -
 121
121 -
 122
122 -
123
-
124
-
125
-
126
-
127
-
128
-
129
-
130
-
131
-
132
-
133
-
134
-
135
-
136
-
137
-
138
-
139
-
140
-
141
-
142
-
143
-
144
-
145
-
146
-
147
-
148
-
149
-
150
-
151
-
152
-
153
-
154
-
155
-
156
-
157
-
158
-
159
-
160
-
161
-
162
-
163
-
164
-
165
-
166
-
167
-
168
-
169
-
170
-
171
-
172
-
173
-
174
-
175
-
176
-
177
-
178
-
179
-
180
-
181
-
182
-
183
-
184
 |
 |

Net revenue decreased for fiscal 2010, as compared to fiscal 2009, primarily due to a $336 million decrease in
License revenue partially offset by a $171 million increase in Content, subscription, and maintenance revenue. The
net decrease was primarily due to decreased license revenue from our Storage and Server Management segment as a
result of the overall market weakness in server sales and tight IT spending due to the global economic slowdown and
the uncertainty surrounding the acquisition of Sun Microsystems, Inc. by Oracle Corporation. This decrease was
partially offset by strength in our Consumer segment and the items discussed above under “Financial Results and
Trends.”
Net revenue increased for fiscal 2009, as compared to fiscal 2008, primarily due to a $302 million increase in
Content, subscription, and maintenance revenue. This increase was primarily related to increased revenue in our
Storage and Server Management and Services segments and the items discussed above under “Financial Results and
Trends.”
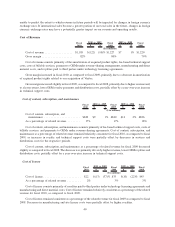
Content, subscription, and maintenance revenue
Fiscal
2010 $ %
Fiscal
2009 $ %
Fiscal
2008
2010 vs. 2009 2009 vs. 2008
($ in millions)
Content, subscription, and maintenance revenue . . $5,034 $171 4% $4,863 $302 7% $4,561
Percentage of total net revenue............... 84% 79% 78%
Content, subscription, and maintenance revenue increased for fiscal 2010, as compared to fiscal 2009, as a
result of strength in our Consumer segment primarily due to increases in revenue from acquired security products
and the gradual global ramp up of our eCommerce platform, as well as revenue from our fiscal 2009 acquisitions of
MessageLabs and PC Tools, and the items discussed above under “Financial Results and Trends.”
Content, subscription, and maintenance revenue increased for fiscal 2009, as compared to fiscal 2008,
primarily due to an aggregate increase in content, subscription and maintenance revenue from the Storage and
Server Management and Services segments of $237 million. The increase in these two segments’ revenue was
largely attributable to demand for our Storage and Server Management products and consulting services as a result
of increased demand for security and storage solutions. This increased demand was driven by the proliferation of
structured and unstructured data and increasing sales of services in conjunction with our license sales. The increased
demand was also a result of our focus on offering our customers a more comprehensive IT solution. Furthermore,
growth in our customer base through acquisitions and new license sales resulted in an increase to Content,
subscription, and maintenance revenue because a large number of our customers renew their annual maintenance
contracts.
License revenue
Fiscal
2010 $ %
Fiscal
2009 $ %
Fiscal
2008
2010 vs. 2009 2009 vs. 2008
($ in millions)
License revenue .......................... $951 $(336) (26)% $1,287 $(26) (2)% $1,313
Percentage of total net revenue............... 16% 21% 22%
License revenue decreased for fiscal 2010, as compared to fiscal 2009, primarily due to the global economic
slowdown and customers emphasizing purchases of smaller volumes of new licenses consistent with their near term
needs during the periods presented, as well as for the items discussed above under “Financial Results and Trends.”
License revenue decreased slightly for fiscal 2009, as compared to fiscal 2008, primarily due to a decrease in
revenue related to our Security and Compliance products, offset by an increase in revenue related to our Storage and
Server Management products. The decreases in Security and Compliance license revenue was primarily a result of
the challenging economic environment and a decline in demand from small and medium businesses. The offsetting
increases in Storage and Server Management license revenue are a result of increased demand for storage solutions
driven by the proliferation of structured and unstructured data.
36