Symantec 2010 Annual Report Download - page 116
Download and view the complete annual report
Please find page 116 of the 2010 Symantec annual report below. You can navigate through the pages in the report by either clicking on the pages listed below, or by using the keyword search tool below to find specific information within the annual report.-
 1
1 -
2
-
3
-
4
-
5
-
6
-
7
-
8
-
9
-
10
-
11
-
12
-
13
-
14
-
15
-
16
-
17
-
18
-
19
-
20
-
21
-
22
-
23
-
24
-
25
-
26
-
27
-
28
-
29
-
30
-
31
-
32
-
33
-
34
-
35
-
36
-
37
-
38
-
39
-
40
-
41
-
42
-
43
-
44
-
45
-
46
-
47
-
48
-
49
-
50
-
51
-
52
-
53
-
54
-
55
-
56
-
57
-
58
-
59
-
60
-
61
-
62
-
63
-
64
-
65
-
66
-
67
-
68
-
69
-
70
-
71
-
72
-
73
-
74
-
75
-
76
-
77
-
78
-
79
-
80
-
81
-
82
-
83
-
84
-
85
-
86
-
87
-
88
-
89
-
90
-
91
-
92
-
93
-
94
-
95
-
96
-
97
-
98
-
99
-
100
-
101
-
102
-
103
-
104
-
105
-
 106
106 -
 107
107 -
 108
108 -
 109
109 -
 110
110 -
 111
111 -
 112
112 -
 113
113 -
 114
114 -
 115
115 -
 116
116 -
 117
117 -
 118
118 -
 119
119 -
 120
120 -
 121
121 -
 122
122 -
 123
123 -
 124
124 -
 125
125 -
 126
126 -
127
-
128
-
129
-
130
-
131
-
132
-
133
-
134
-
135
-
136
-
137
-
138
-
139
-
140
-
141
-
142
-
143
-
144
-
145
-
146
-
147
-
148
-
149
-
150
-
151
-
152
-
153
-
154
-
155
-
156
-
157
-
158
-
159
-
160
-
161
-
162
-
163
-
164
-
165
-
166
-
167
-
168
-
169
-
170
-
171
-
172
-
173
-
174
-
175
-
176
-
177
-
178
-
179
-
180
-
181
-
182
-
183
-
184
 |
 |

unable to predict the extent to which revenue in future periods will be impacted by changes in foreign currency
exchange rates. If international sales become a greater portion of our total sales in the future, changes in foreign
currency exchange rates may have a potentially greater impact on our revenue and operating results.
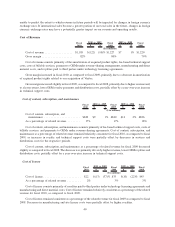
Cost of Revenue
Fiscal
2010 $ %
Fiscal
2009 $ %
Fiscal
2008
2010 vs. 2009 2009 vs. 2008
($ in millions)
Cost of revenue .................. $1,105 $(122) (10)% $1,227 $7 1% $1,220
Gross margin .................... 82% 80% 79%
Cost of revenue consists primarily of the amortization of acquired product rights, fee-based technical support
costs, costs of billable services, payments to OEMs under revenue-sharing arrangements, manufacturing and direct
material costs, and royalties paid to third parties under technology licensing agreements.
Gross margin increased in fiscal 2010, as compared to fiscal 2009, primarily due to a decrease in amortization
of acquired product rights related to our acquisition of Veritas.
Gross margin increased slightly in fiscal 2009, as compared to fiscal 2008, primarily due to higher revenue and,
to a lesser extent, lower OEM royalty payments and distribution costs, partially offset by a year-over-year increase
in technical support costs.
Cost of content, subscription, and maintenance
Fiscal
2010 $ %
Fiscal
2009 $ %
Fiscal
2008
2010 vs. 2009 2009 vs. 2008
($ in millions)
Cost of content, subscription, and
maintenance ....................... $849 $9 1% $840 $14 2% $826
As a percentage of related revenue......... 17% 17% 18%
Cost of content, subscription, and maintenance consists primarily of fee-based technical support costs, costs of
billable services, and payments to OEMs under revenue-sharing agreements. Cost of content, subscription, and
maintenance as a percentage of related revenue remained relatively consistent for fiscal 2010, as compared to fiscal
2009, as increases in royalty and technical support costs were partially offset by decreases in services and
distribution costs for the respective periods.
Cost of content, subscription, and maintenance as a percentage of related revenue for fiscal 2009 decreased
slightly as compared to fiscal 2008. The decrease was primarily driven by higher revenue, lower OEM royalties and
distribution costs, partially offset by a year-over-year increase in technical support costs.
Cost of license
Fiscal
2010 $ %
Fiscal
2009 $ %
Fiscal
2008
2010 vs. 2009 2009 vs. 2008
($ in millions)
Cost of license ........................ $22 $(13) (37)% $35 $(10) (22)% $45
As a percentage of related revenue ......... 2% 3% 3%
Cost of license consists primarily of royalties paid to third parties under technology licensing agreements and
manufacturing and direct material costs. Cost of license remained relatively consistent as a percentage of the related
revenue for fiscal 2010, as compared to fiscal 2009.
Cost of license remained consistent as a percentage of the related revenue for fiscal 2009 as compared to fiscal
2008. Decreases in manufacturing and site license costs were partially offset by higher royalties.
40