Symantec 2010 Annual Report Download - page 118
Download and view the complete annual report
Please find page 118 of the 2010 Symantec annual report below. You can navigate through the pages in the report by either clicking on the pages listed below, or by using the keyword search tool below to find specific information within the annual report.-
 1
1 -
2
-
3
-
4
-
5
-
6
-
7
-
8
-
9
-
10
-
11
-
12
-
13
-
14
-
15
-
16
-
17
-
18
-
19
-
20
-
21
-
22
-
23
-
24
-
25
-
26
-
27
-
28
-
29
-
30
-
31
-
32
-
33
-
34
-
35
-
36
-
37
-
38
-
39
-
40
-
41
-
42
-
43
-
44
-
45
-
46
-
47
-
48
-
49
-
50
-
51
-
52
-
53
-
54
-
55
-
56
-
57
-
58
-
59
-
60
-
61
-
62
-
63
-
64
-
65
-
66
-
67
-
68
-
69
-
70
-
71
-
72
-
73
-
74
-
75
-
76
-
77
-
78
-
79
-
80
-
81
-
82
-
83
-
84
-
85
-
86
-
87
-
88
-
89
-
90
-
91
-
92
-
93
-
94
-
95
-
96
-
97
-
98
-
99
-
100
-
101
-
102
-
103
-
104
-
105
-
106
-
107
-
 108
108 -
 109
109 -
 110
110 -
 111
111 -
 112
112 -
 113
113 -
 114
114 -
 115
115 -
 116
116 -
 117
117 -
 118
118 -
 119
119 -
 120
120 -
 121
121 -
 122
122 -
 123
123 -
 124
124 -
 125
125 -
 126
126 -
 127
127 -
 128
128 -
129
-
130
-
131
-
132
-
133
-
134
-
135
-
136
-
137
-
138
-
139
-
140
-
141
-
142
-
143
-
144
-
145
-
146
-
147
-
148
-
149
-
150
-
151
-
152
-
153
-
154
-
155
-
156
-
157
-
158
-
159
-
160
-
161
-
162
-
163
-
164
-
165
-
166
-
167
-
168
-
169
-
170
-
171
-
172
-
173
-
174
-
175
-
176
-
177
-
178
-
179
-
180
-
181
-
182
-
183
-
184
 |
 |

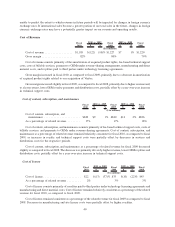
As a percent of net revenue, research and development expense has remained relatively consistent in fiscal
2010, 2009 and 2008.
General and administrative expense
Fiscal
2010 $ %
Fiscal
2009 $ %
Fiscal
2008
2010 vs. 2009 2009 vs. 2008
($ in millions)
General and administrative expense ....... $352 $9 3% $343 $(5) (1)% $348
Percentage of total net revenue ........... 6% 6% 6%
General and administrative expense has remained relatively consistent for the periods presented, both in
absolute dollars and as a percentage of net revenue.
Amortization of other purchased intangible assets
Fiscal
2010 $ %
Fiscal
2009 $ %
Fiscal
2008
2010 vs. 2009 2009 vs. 2008
($ in millions)
Amortization of other purchased intangible assets .... $247 $14 6% $233 $8 4% $225
Percentage of total net revenue .................. 4% 4% 4%
Other purchased intangible assets are comprised of customer relationships and tradenames. Amortization for
fiscal 2010, compared to fiscal 2009, increased as a result of our fiscal 2009 acquisitions. As a percentage of net
revenue, amortization of other purchased intangible assets remained relatively consistent for fiscal 2010 compared
to fiscal 2009. Amortization for fiscal 2009 compared to fiscal 2008 was relatively consistent.
Restructuring and transformation
Fiscal
2010 $ %
Fiscal
2009 $ %
Fiscal
2008
2010 vs. 2009 2009 vs. 2008
($ in millions)
Severance ............................... $56 $64 $59
Facilities and other......................... 10 11 15
Transition, transformation and other costs ........ 28 21 —
Restructuring and transformation ................ $94 $(2) (2)% $96 $22 30% $74
Percentage of total net revenue.................. 2% 2% 1%
The restructuring charges for fiscal 2010 primarily consisted of severance and charges related to the 2010
Restructuring Plan (“2010 Plan”) and 2008 Restructuring Plan (“2008 Plan”), and transition and transformation
costs related to the outsourcing of certain back office functions. The restructuring charges for fiscal 2009 and fiscal
2008, primarily consisted of severance charges related to the 2008 Plan and prior plans and acquisition-related
plans.
Total remaining severance charges are estimated to range from $50 million to $80 million, primarily for the
2010 Plan. Total remaining facilities charges are estimated to range from $35 million to $45 million related to the
2010 Plan. Total remaining costs for the transition and transformation activities associated with outsourcing back
office functions are estimated to be approximately $10 million to $20 million. For further information on
restructuring, see Note 8 of the Notes to Consolidated Financial Statements.
42