Symantec 2010 Annual Report Download - page 123
Download and view the complete annual report
Please find page 123 of the 2010 Symantec annual report below. You can navigate through the pages in the report by either clicking on the pages listed below, or by using the keyword search tool below to find specific information within the annual report.-
 1
1 -
2
-
3
-
4
-
5
-
6
-
7
-
8
-
9
-
10
-
11
-
12
-
13
-
14
-
15
-
16
-
17
-
18
-
19
-
20
-
21
-
22
-
23
-
24
-
25
-
26
-
27
-
28
-
29
-
30
-
31
-
32
-
33
-
34
-
35
-
36
-
37
-
38
-
39
-
40
-
41
-
42
-
43
-
44
-
45
-
46
-
47
-
48
-
49
-
50
-
51
-
52
-
53
-
54
-
55
-
56
-
57
-
58
-
59
-
60
-
61
-
62
-
63
-
64
-
65
-
66
-
67
-
68
-
69
-
70
-
71
-
72
-
73
-
74
-
75
-
76
-
77
-
78
-
79
-
80
-
81
-
82
-
83
-
84
-
85
-
86
-
87
-
88
-
89
-
90
-
91
-
92
-
93
-
94
-
95
-
96
-
97
-
98
-
99
-
100
-
101
-
102
-
103
-
104
-
105
-
106
-
107
-
108
-
109
-
110
-
111
-
112
-
 113
113 -
 114
114 -
 115
115 -
 116
116 -
 117
117 -
 118
118 -
 119
119 -
 120
120 -
 121
121 -
 122
122 -
 123
123 -
 124
124 -
 125
125 -
 126
126 -
 127
127 -
 128
128 -
 129
129 -
 130
130 -
 131
131 -
 132
132 -
 133
133 -
134
-
135
-
136
-
137
-
138
-
139
-
140
-
141
-
142
-
143
-
144
-
145
-
146
-
147
-
148
-
149
-
150
-
151
-
152
-
153
-
154
-
155
-
156
-
157
-
158
-
159
-
160
-
161
-
162
-
163
-
164
-
165
-
166
-
167
-
168
-
169
-
170
-
171
-
172
-
173
-
174
-
175
-
176
-
177
-
178
-
179
-
180
-
181
-
182
-
183
-
184
 |
 |

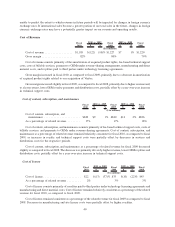
Cash Flows
The following table summarizes, for the periods indicated, selected items in our Consolidated Statements of
Cash Flows:
2010 2009 2008
Fiscal
(In millions)
Net cash provided by (used in)
Operating activities .................................... $1,693 $1,671 $1,819
Investing activities ..................................... (65) (961) (1,526)
Financing activities .................................... (441) (677) (1,066)
Operating Activities
Net cash provided by operating activities was $1.7 billion for fiscal 2010, which resulted from net income of
$714 million adjusted for non-cash items, including depreciation and amortization charges of $837 million and
stock-based compensation expense of $155 million. These amounts were partially offset by a decrease in income
taxes payable of $105 million primarily related to the outcome of the Veritas v. Commissioner Tax Court decision
(see Note 13).
Net cash provided by operating activities was $1.7 billion for fiscal 2009, which resulted from non-cash
charges related to depreciation and amortization expenses of $933 million and the $7.4 billion goodwill impairment
charge offset by the net loss of $6.8 billion.
Net cash provided by operating activities was $1.8 billion for fiscal 2008, which resulted from net income of
$410 million adjusted for non-cash items, including depreciation and amortization charges of $915 million, stock-
based compensation expense of $164 million, income taxes payable of $196 million and an increase in deferred
revenue of $127 million. These amounts were partially offset by a decrease in non-cash deferred income taxes of
$216 million.
Investing Activities
Net cash used in investing activities was $65 million for fiscal 2010 and was primarily due to $248 million paid
for capital expenditures, partially offset by net proceeds from the sale of available-for-sale securities of
$190 million.
Net cash used in investing activities was $1.0 billion for fiscal 2009 and was primarily due to an aggregate
payment of $1.1 billion in cash payments for acquisitions, net of cash acquired, and $272 million paid for capital
expenditures, partially offset by net proceeds of $336 million from the sale of short-term investments which were
used to partially fund acquisitions.
Net cash used in investing activities was $1.5 billion for fiscal 2008 and was primarily due to an aggregate
payment of $1.3 billion in cash paid for acquisitions and the joint venture, net of cash acquired.
Financing Activities
Net cash used in financing activities of $441 million for fiscal 2010 was due to repurchases of common stock of
$553 million, partially offset by net proceeds from sales of common stock through employee stock plans of
$124 million.
Net cash used in financing activities was $677 million for fiscal 2009 and was primarily due to repurchases of
common stock of $700 million and the repayment of $200 million on our revolving credit facility, partially offset by
net proceeds from sales of common stock through employee stock plans of $229 million.
Net cash used in financing activities was $1.1 billion for fiscal 2008 and was primarily due to repurchases of
common stock of $1.5 billion, partially offset by the net proceeds from sales of common stock through employee
stock plans of $224 million and a borrowing on our revolving credit facility of $200 million.
47