Symantec 2010 Annual Report Download - page 114
Download and view the complete annual report
Please find page 114 of the 2010 Symantec annual report below. You can navigate through the pages in the report by either clicking on the pages listed below, or by using the keyword search tool below to find specific information within the annual report.-
 1
1 -
2
-
3
-
4
-
5
-
6
-
7
-
8
-
9
-
10
-
11
-
12
-
13
-
14
-
15
-
16
-
17
-
18
-
19
-
20
-
21
-
22
-
23
-
24
-
25
-
26
-
27
-
28
-
29
-
30
-
31
-
32
-
33
-
34
-
35
-
36
-
37
-
38
-
39
-
40
-
41
-
42
-
43
-
44
-
45
-
46
-
47
-
48
-
49
-
50
-
51
-
52
-
53
-
54
-
55
-
56
-
57
-
58
-
59
-
60
-
61
-
62
-
63
-
64
-
65
-
66
-
67
-
68
-
69
-
70
-
71
-
72
-
73
-
74
-
75
-
76
-
77
-
78
-
79
-
80
-
81
-
82
-
83
-
84
-
85
-
86
-
87
-
88
-
89
-
90
-
91
-
92
-
93
-
94
-
95
-
96
-
97
-
98
-
99
-
100
-
101
-
102
-
103
-
 104
104 -
 105
105 -
 106
106 -
 107
107 -
 108
108 -
 109
109 -
 110
110 -
 111
111 -
 112
112 -
 113
113 -
 114
114 -
 115
115 -
 116
116 -
 117
117 -
 118
118 -
 119
119 -
 120
120 -
 121
121 -
 122
122 -
 123
123 -
 124
124 -
125
-
126
-
127
-
128
-
129
-
130
-
131
-
132
-
133
-
134
-
135
-
136
-
137
-
138
-
139
-
140
-
141
-
142
-
143
-
144
-
145
-
146
-
147
-
148
-
149
-
150
-
151
-
152
-
153
-
154
-
155
-
156
-
157
-
158
-
159
-
160
-
161
-
162
-
163
-
164
-
165
-
166
-
167
-
168
-
169
-
170
-
171
-
172
-
173
-
174
-
175
-
176
-
177
-
178
-
179
-
180
-
181
-
182
-
183
-
184
 |
 |

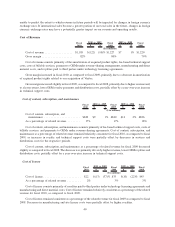
Storage and Server Management Segment
Fiscal
2010 $ %
Fiscal
2009 $ %
Fiscal
2008
2010 vs. 2009 2009 vs. 2008
($ in millions)
Storage and Server Management segment. . . . . . . $2,287 $(206) (8)% $2,493 $190 8% $2,303
Percentage of total net revenue . . . . . . . . . . . . . . 38% 40% 39%
Storage and Server Management operating
income . . . . . . . . . . . . . . . . . . . . . . . . . . . . . . $1,097 $ 16 1% $1,081 $361 50% $ 720
Percentage of Storage and Server Management
revenue . . . . . . . . . . . . . . . . . . . . . . . . . . . . . . 48% 43% 31%
Storage and Server Management revenue decreased for fiscal 2010, as compared to fiscal 2009, primarily due
to the overall market weakness in server sales and our customers buying smaller volumes of new licenses consistent
with their near term needs, particularly with respect to our storage management products, as well as the items
discussed above under “Financial Results and Trends.”
Operating income for the Storage and Server Management segment increased for fiscal 2010, as compared to
fiscal 2009, as the decrease in expenses more than offset the decrease in revenue due to our ongoing focus on cost
efficiency.
Storage and Server Management revenue increased for fiscal 2009, as compared to fiscal 2008, primarily due
to increased sales of products related to storage management, data protection, disaster recovery and products
supporting high availability. The demand for these products was driven by the increase in the proliferation of
structured and unstructured data, as well as the increasing demand for optimization of storage systems.
Operating income for the Storage and Server Management segment increased for fiscal 2009, as compared to
fiscal 2008, as the growth in revenue was coupled with a decrease in expenses. Total expenses for fiscal 2009
decreased partly as a result of fiscal 2008 divestiture of a business.
Services Segment
Fiscal
2010 $ %
Fiscal
2009 $ %
Fiscal
2008
2010 vs. 2009 2009 vs. 2008
($ in millions)
Services segment . . . . . . . . . . . . . . . . . . . . . . . . . . . . . . $416 $(17) (4)% $433 $52 14% $381
Percentage of total net revenue . . . . . . . . . . . . . . . . . . . . 7% 7% 6%
Services operating income (loss). . . . . . . . . . . . . . . . . . . $ 42 $ 9 27% $ 33 $56 243% $ (23)
Percentage of Services revenue . . . . . . . . . . . . . . . . . . . . 10% 8% (6)%
Services revenue decreased for fiscal 2010, as compared to fiscal 2009, primarily due to a reduction in
consulting revenue associated with new license sales, in addition to the items discussed above under “Financial
Results and Trends.”
Operating income for the Services segment increased for fiscal 2010, as compared to fiscal 2009, as various
cost control initiatives led to better margins.
Services revenue increased for fiscal 2009, as compared to fiscal 2008, primarily due to an increase in revenue
in our consulting services and Business Critical Services, as a result of increased demand for more comprehensive
software implementation assistance and increased demand for our Business Critical Services. Customers purchased
our service offerings in conjunction with the purchase of our products and augmented the capabilities of their own
IT staff with our onsite consultants.
The operating loss for the Services segment decreased for fiscal 2009, as compared to fiscal 2008, as revenue
growth exceeded expense growth for the segment. Our focus on margin improvement contributed to the decrease in
operating loss.
38