Symantec 2010 Annual Report Download - page 117
Download and view the complete annual report
Please find page 117 of the 2010 Symantec annual report below. You can navigate through the pages in the report by either clicking on the pages listed below, or by using the keyword search tool below to find specific information within the annual report.-
 1
1 -
2
-
3
-
4
-
5
-
6
-
7
-
8
-
9
-
10
-
11
-
12
-
13
-
14
-
15
-
16
-
17
-
18
-
19
-
20
-
21
-
22
-
23
-
24
-
25
-
26
-
27
-
28
-
29
-
30
-
31
-
32
-
33
-
34
-
35
-
36
-
37
-
38
-
39
-
40
-
41
-
42
-
43
-
44
-
45
-
46
-
47
-
48
-
49
-
50
-
51
-
52
-
53
-
54
-
55
-
56
-
57
-
58
-
59
-
60
-
61
-
62
-
63
-
64
-
65
-
66
-
67
-
68
-
69
-
70
-
71
-
72
-
73
-
74
-
75
-
76
-
77
-
78
-
79
-
80
-
81
-
82
-
83
-
84
-
85
-
86
-
87
-
88
-
89
-
90
-
91
-
92
-
93
-
94
-
95
-
96
-
97
-
98
-
99
-
100
-
101
-
102
-
103
-
104
-
105
-
106
-
 107
107 -
 108
108 -
 109
109 -
 110
110 -
 111
111 -
 112
112 -
 113
113 -
 114
114 -
 115
115 -
 116
116 -
 117
117 -
 118
118 -
 119
119 -
 120
120 -
 121
121 -
 122
122 -
 123
123 -
 124
124 -
 125
125 -
 126
126 -
 127
127 -
128
-
129
-
130
-
131
-
132
-
133
-
134
-
135
-
136
-
137
-
138
-
139
-
140
-
141
-
142
-
143
-
144
-
145
-
146
-
147
-
148
-
149
-
150
-
151
-
152
-
153
-
154
-
155
-
156
-
157
-
158
-
159
-
160
-
161
-
162
-
163
-
164
-
165
-
166
-
167
-
168
-
169
-
170
-
171
-
172
-
173
-
174
-
175
-
176
-
177
-
178
-
179
-
180
-
181
-
182
-
183
-
184
 |
 |

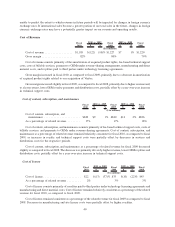
Amortization of acquired product rights
Fiscal
2010 $ %
Fiscal
2009 $ %
Fiscal
2008
2010 vs. 2009 2009 vs. 2008
($ in millions)
Amortization of acquired product rights .... $234 $(118) (34)% $352 $3 1% $349
Percentage of total net revenue ........... 4% 6% 6%
Acquired product rights are comprised of developed technologies and patents from acquired companies. The
decrease in amortization for fiscal 2010, as compared to fiscal 2009, was primarily due to certain acquired product
rights from our acquisition of Veritas becoming fully amortized during the first quarter of our fiscal 2010. This
decrease was partially offset by additional amortization from product rights acquired from SwapDrive, PC Tools
and MessageLabs during fiscal 2009.
The increase in amortization for fiscal 2009, as compared to fiscal 2008, was primarily due to amortization
associated with our SwapDrive, PC Tools and MessageLabs acquisitions during fiscal 2009, offset in part by the
APM business divestiture in fiscal 2008.
Operating Expenses
Operating expenses overview
As discussed above under “Financial Results and Trends,” our operating expenses for fiscal 2010 include
52 weeks of activity as compared to 53 weeks for fiscal 2009, which had a favorable impact on the year-over-year
comparison of our operating expenses. Our operating expenses for fiscal 2010, as compared to fiscal 2009, were not
materially impacted by changes in foreign exchange rates.
Our operating expenses for fiscal 2009, as compared to fiscal 2008, increased as a result of an additional week
during fiscal 2009, which was partially offset by a stronger U.S. dollar in fiscal 2009 compared to fiscal 2008.
Our operating expenses for Fiscal 2010, 2009 and 2008 were favorably impacted by the restructuring plans
discussed below.
Sales and marketing expense
Fiscal
2010 $ %
Fiscal
2009 $ %
Fiscal
2008
2010 vs. 2009 2009 vs. 2008
($ in millions)
Sales and marketing expense ....... $2,367 $(19) (1)% $2,386 $(29) (1)% $2,415
Percentage of total net revenue ..... 40% 39% 41%
Sales and marketing expense remained relatively flat during fiscal 2010 as compared to fiscal 2009. Fiscal 2010
sales and marketing expense reflects the impact of our prior year restructuring plan, partially offset by increases in
headcount related expenses from our fiscal 2009 acquisitions and increases in Consumer OEM fees and costs associated
with the development and operations of our new proprietary eCommerce platform. As a percent of net revenue, sales and
marketing expense increased as a result of these factors coupled with the decrease in total net revenue.
Sales and marketing expense decreased during fiscal 2009, as compared to fiscal 2008, as a result of favorable
foreign exchange rates and our restructuring plans, partially offset by an additional week of operations for fiscal
2009. As a percent of net revenue, sales and marketing expense decreased as a result of these factors coupled with
the increase in total net revenue.
Research and development expense
Fiscal
2010 $ %
Fiscal
2009 $ %
Fiscal
2008
2010 vs. 2009 2009 vs. 2008
($ in millions)
Research and development expense ...... $857 $(13) (1)% $870 $(25) (3)% $895
Percentage of total net revenue ......... 14% 14% 15%
41