Symantec 2010 Annual Report Download - page 113
Download and view the complete annual report
Please find page 113 of the 2010 Symantec annual report below. You can navigate through the pages in the report by either clicking on the pages listed below, or by using the keyword search tool below to find specific information within the annual report.-
 1
1 -
2
-
3
-
4
-
5
-
6
-
7
-
8
-
9
-
10
-
11
-
12
-
13
-
14
-
15
-
16
-
17
-
18
-
19
-
20
-
21
-
22
-
23
-
24
-
25
-
26
-
27
-
28
-
29
-
30
-
31
-
32
-
33
-
34
-
35
-
36
-
37
-
38
-
39
-
40
-
41
-
42
-
43
-
44
-
45
-
46
-
47
-
48
-
49
-
50
-
51
-
52
-
53
-
54
-
55
-
56
-
57
-
58
-
59
-
60
-
61
-
62
-
63
-
64
-
65
-
66
-
67
-
68
-
69
-
70
-
71
-
72
-
73
-
74
-
75
-
76
-
77
-
78
-
79
-
80
-
81
-
82
-
83
-
84
-
85
-
86
-
87
-
88
-
89
-
90
-
91
-
92
-
93
-
94
-
95
-
96
-
97
-
98
-
99
-
100
-
101
-
102
-
 103
103 -
 104
104 -
 105
105 -
 106
106 -
 107
107 -
 108
108 -
 109
109 -
 110
110 -
 111
111 -
 112
112 -
 113
113 -
 114
114 -
 115
115 -
 116
116 -
 117
117 -
 118
118 -
 119
119 -
 120
120 -
 121
121 -
 122
122 -
 123
123 -
124
-
125
-
126
-
127
-
128
-
129
-
130
-
131
-
132
-
133
-
134
-
135
-
136
-
137
-
138
-
139
-
140
-
141
-
142
-
143
-
144
-
145
-
146
-
147
-
148
-
149
-
150
-
151
-
152
-
153
-
154
-
155
-
156
-
157
-
158
-
159
-
160
-
161
-
162
-
163
-
164
-
165
-
166
-
167
-
168
-
169
-
170
-
171
-
172
-
173
-
174
-
175
-
176
-
177
-
178
-
179
-
180
-
181
-
182
-
183
-
184
 |
 |

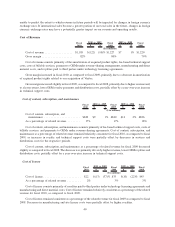
Net revenue and operating income by segment
Consumer Segment
Fiscal
2010 $ %
Fiscal
2009 $ %
Fiscal
2008
2010 vs. 2009 2009 vs. 2008
($ in millions)
Consumer revenue . . . . . . . . . . . . . . . . . . . . . . . . . $1,871 $ 98 6% $1,773 $27 2% $1,746
Percentage of total net revenue. . . . . . . . . . . . . . . . 31% 29% 30%
Consumer operating income . . . . . . . . . . . . . . . . . . $ 860 $(88) (9)% $ 948 $ 9 1% $ 939
Percentage of Consumer revenue . . . . . . . . . . . . . . 46% 53% 54%
Consumer revenue increased for fiscal 2010, as compared to fiscal 2009, primarily due to increases in revenue
from acquired security products, our core consumer products in the electronic channel, and the items discussed
above under “Financial Results and Trends.”
Our electronic channel sales are derived from OEMs, subscriptions, upgrades, online sales, and renewals.
Electronic channel revenue has increased year-over-year since fiscal 2008. Electronic sales accounted for
approximately 81%, 78%, and 73% of Consumer revenue for fiscal 2010, 2009 and 2008, respectively.
Operating income for the Consumer segment decreased for fiscal 2010, as compared to fiscal 2009, as expense
growth outpaced revenue growth. Total expenses for the segment increased primarily as a result of the higher OEM
placement fees and costs associated with our development and operation of our new proprietary eCommerce
platform, both discussed above under “Financial Results and Trends.”
Consumer revenue increased for fiscal 2009, as compared to fiscal 2008, primarily due to an increase from our
core consumer security products in our electronic channels, partially offset by a decrease in our retail channels. In
addition, Consumer revenue increased from the sale of our consumer services and acquired security products.
Operating income for this segment increased for fiscal 2009, as compared to fiscal 2008, as the increase in
revenue more than offset the increase in expenses. Total expenses for fiscal 2009 increased primarily as a result of
the PC Tools acquisition.
Security and Compliance Segment
Fiscal
2010 $ %
Fiscal
2009 $ %
Fiscal
2008
2010 vs. 2009 2009 vs. 2008
($ in millions)
Security and Compliance revenue. . . . . . . . . . . . . . $1,411 $(39) (3)% $1,450 $ 8 1% $1,442
Percentage of total net revenue. . . . . . . . . . . . . . . . 24% 24% 25%
Security and Compliance operating income. . . . . . . $ 371 $(69) (16)% $ 440 $21 5% $ 419
Percentage of Security and Compliance revenue . . . 26% 30% 29%
Security and Compliance revenue decreased for fiscal 2010, as compared to fiscal 2009, as a result of the items
discussed above under “Financial Results and Trends,” partially offset by increases in revenue from acquired
security products.
Operating income for the segment decreased for fiscal 2010, as compared to fiscal 2009, as revenue decreased
while expenses increased as a result of our fiscal 2009 acquisitions, partially offset by our cost containment
measures.
Security and Compliance revenue was relatively consistent for fiscal 2009, as compared to fiscal 2008.
Operating income for the Security and Compliance segment increased for fiscal 2009, as compared to fiscal
2008, as expenses decreased while revenue growth remained relatively consistent. Total expenses for fiscal 2009
benefited from our ongoing focus on cost efficiency.
37