Symantec 2010 Annual Report Download - page 119
Download and view the complete annual report
Please find page 119 of the 2010 Symantec annual report below. You can navigate through the pages in the report by either clicking on the pages listed below, or by using the keyword search tool below to find specific information within the annual report.-
 1
1 -
2
-
3
-
4
-
5
-
6
-
7
-
8
-
9
-
10
-
11
-
12
-
13
-
14
-
15
-
16
-
17
-
18
-
19
-
20
-
21
-
22
-
23
-
24
-
25
-
26
-
27
-
28
-
29
-
30
-
31
-
32
-
33
-
34
-
35
-
36
-
37
-
38
-
39
-
40
-
41
-
42
-
43
-
44
-
45
-
46
-
47
-
48
-
49
-
50
-
51
-
52
-
53
-
54
-
55
-
56
-
57
-
58
-
59
-
60
-
61
-
62
-
63
-
64
-
65
-
66
-
67
-
68
-
69
-
70
-
71
-
72
-
73
-
74
-
75
-
76
-
77
-
78
-
79
-
80
-
81
-
82
-
83
-
84
-
85
-
86
-
87
-
88
-
89
-
90
-
91
-
92
-
93
-
94
-
95
-
96
-
97
-
98
-
99
-
100
-
101
-
102
-
103
-
104
-
105
-
106
-
107
-
108
-
 109
109 -
 110
110 -
 111
111 -
 112
112 -
 113
113 -
 114
114 -
 115
115 -
 116
116 -
 117
117 -
 118
118 -
 119
119 -
 120
120 -
 121
121 -
 122
122 -
 123
123 -
 124
124 -
 125
125 -
 126
126 -
 127
127 -
 128
128 -
 129
129 -
130
-
131
-
132
-
133
-
134
-
135
-
136
-
137
-
138
-
139
-
140
-
141
-
142
-
143
-
144
-
145
-
146
-
147
-
148
-
149
-
150
-
151
-
152
-
153
-
154
-
155
-
156
-
157
-
158
-
159
-
160
-
161
-
162
-
163
-
164
-
165
-
166
-
167
-
168
-
169
-
170
-
171
-
172
-
173
-
174
-
175
-
176
-
177
-
178
-
179
-
180
-
181
-
182
-
183
-
184
 |
 |

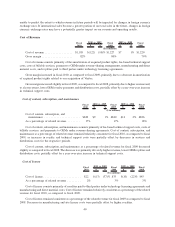
Impairment of goodwill and Loss and impairment of assets held for sale
Fiscal
2010 $ %
Fiscal
2009 $ %
Fiscal
2008
2010 vs. 2009 2009 vs. 2008
($ in millions)
Impairment of goodwill ........... $— $(7,419) (100)% $7,419 $7,419 100% $—
Percentage of total net revenue ..... 0% 121% 0%
Loss and impairment of assets held
forsale..................... $30 $ (16) (35)% $ 46 $ (49) (52)% $95
Percentage of total net revenue ..... 1% 1% 2%
In accordance with the authoritative guidance on goodwill and other intangibles, we evaluate goodwill for
impairment at least annually and any time business conditions indicate a potential change in recoverability. During
the fourth quarter of fiscal 2010, we performed our annual impairment analysis and determined that goodwill was
not impaired. During the third quarter of fiscal 2009, we concluded that there were impairment indicators, including
the challenging economic environment and a decline in our market capitalization, which required us to perform an
interim goodwill impairment analysis. The analysis was not completed during the third quarter of fiscal 2009 and an
estimated impairment charge of $7.0 billion was recorded. The analysis was subsequently finalized and an
additional impairment charge of $413 million was included in our results for the fourth quarter of fiscal 2009. As a
result, we incurred a total impairment charge of $7.4 billion for fiscal 2009. We also performed our annual
impairment analysis during the fourth quarter of fiscal 2009 and determined that no additional impairment charge
was necessary.
For the purposes of this analysis, our estimates of fair value are based on a combination of the income
approach, and the market approach. The income approach estimates the fair value of our reporting units based on the
future discounted cash flows. We also consider the market approach, which estimates the fair value of our reporting
units based on comparable market prices.
During fiscal 2010, 2009 and 2008, we recognized impairments of $20 million, $46 million, and $93 million,
respectively, on certain land and buildings classified as held for sale. The impairments were recorded in accordance
with the authoritative guidance that requires a long-lived asset classified as held for sale to be measured at the lower
of its carrying amount or fair value, less cost to sell. Also, in fiscal 2010 and 2008, we sold assets for $42 million and
$98 million, which resulted in losses of $10 million and $2 million, respectively. We sold properties in fiscal 2009
for $40 million with an immaterial loss.
Non-operating income and expense
Fiscal
2010 $ %
Fiscal
2009 $ %
Fiscal
2008
2010 vs. 2009 2009 vs. 2008
($ in millions)
Interest income . ...................... $ 6 $ 37 $ 77
Interest expense . ...................... (129) (125) (119)
Other income, net ..................... 55 8 63
Total............................. $ (68) $12 (15)%$ (80) $(101) (481)% $ 21
Percentage of total net revenue............ (1)% (1)% 0%
The decrease in interest income during fiscal 2010, as compared to fiscal 2009, is due to a lower average yield
on our invested cash and short-term investment balances. Interest expense for fiscal 2010, as compared to fiscal
2009, remained relatively consistent. Other income, net for fiscal 2010 includes net gains of $47 million from the
liquidation of certain foreign legal entities. The liquidations resulted in the release of cumulative translation
adjustments from accumulated other comprehensive income related to these entities.
43